UNITED STATES
SECURITIES AND EXCHANGE COMMISSION
Washington, D.C. 20549
![]()
20182021 ANNUAL MEETING OF SHAREHOLDERS
Dear Fellow Shareholders:
| | Dear Fellow Shareholders: On behalf of the Board of Trustees and employees of Eversource Energy, it is my pleasure to invite you to attend the virtual May 5, 2021 Annual Meeting of Shareholders of Eversource Energy. You can find additional information on how to participate in the Annual Meeting starting on the next page. I would first like to tell you how proud I am of what our team achieved in 2020 on behalf of our customers, communities, and investors under difficult circumstances. Eversource’s more than 9,000 employees faced unprecedented challenges from the global COVID-19 pandemic, responding to numerous storms and emergencies, advancing our clean energy and carbon neutrality goals, working to complete a strategic acquisition, and delivering strong financial results for our shareholders. As an essential service provider, Eversource plans for major disruptions and was ready to respond. We moved quickly to remote work, adopted new safety protocols for field-based employees and coordinated closely with our communities to perform our essential work. We proactively stopped customer disconnections for non-payment, established flexible payment plans, and set up a dedicated team to help small business customers apply for federal assistance. | | | ![[MISSING IMAGE: ph_jamesjudge1-bw.jpg]](https://capedge.com/proxy/DEF 14A/0001104659-21-042415/ph_jamesjudge1-bw.jpg) | |
Please seepandemic behind us in 2021. Whatever the accompanying Notice of Annual Meeting of Shareholdersyear brings, we know Eversource will remain a catalyst for clean energy and proxy statement for information on the matters to be acted upon at the meeting. Our meeting agenda will also includeinclusion and a discussion of the operations of the Eversource Energy system companies and an opportunity for your questions.
In 2017, we continued to achieve very positive financial and operating performance results:
Three of our Trustees, John S. Clarkeson, Charles K. Gifford, and Paul A. La Camera, will retire from the Board effective on the date of our Annual Meeting. We thank them for their exceptional service to the Board and the Company.
When I became your Chief Executive Officer in 2016, I set a goal for Eversource Energy to be known as the best energy company in the country by the year 2020. We made great progress last year toward achieving that goal, and intend to continue to make great progress in 2018.
4.3 million customers. On behalf of your Board of Trustees, I thank you for your continued support of Eversource Energy.
![[MISSING IMAGE: sg_jamesjudge-bw.jpg]](https://capedge.com/proxy/DEF 14A/0001104659-21-042415/sg_jamesjudge-bw.jpg)
| | DATE: | | | Wednesday, May 5, 2021 | |
 | TIME: |
|
March 23, 2018
![]()
|
| | | 10:30 a.m. Eastern Time | |
| PLACE: | |||
| | |||
You are entitled to vote at
Voting
Whether or not you plan toour transfer agent, Computershare) may attend the Annual Meeting it is important that yourby accessing the meeting center at http://www.meetingcenter.io/
Meeting Admission
You26, 2021. All shareholders are urged to vote and submit their proxies in advance of or your proxy are entitled to attendat the Annual Meeting.
March 23, 2018
Important Notice Regarding the Availability of Proxy Statement MaterialsConduct for the Annual Meeting of Shareholders tothat are available in the meeting center at the website address above.
TableBy Order of ContentsTrustees,![]() Richard J. Morrison
Richard J. Morrison
SecretaryMarch 26, 2021 PROXY STATEMENT SUMMARY1 Important Notice Regarding the Availability of Proxy Statement Materials for the Annual Meeting of Shareholders to be held on May 5, 2021. The Proxy Statement for the Annual Meeting of Shareholders to be held on May 5, 2021 and the 2020 Annual Report are available on the Internet at www.edocumentview.com/ES
| | | | | | 1 | | | |
| | | | | 1 | | | ||
| | | | | | | |||
| | | | | | | | ||
| | | | | | | |||
| | | | | | 5 | | | |
| | ||||||||
| | | | | 6 | | | ||
| | ||||||||
| | | | | 13 | | | ||
| | | | | | | | ||
| | | | | | | | ||
| | | | | | | | ||
| | | | | | | | ||
| | | | | | | | ||
| | | | | | | |||
| | | | | | | | ||
| | | | | | | | ||
| | | | | | | | ||
| | | | | | 22 | | ||
| | | | | | | | ||
| | | | | | 28 | | | |
| | | | | | | | ||
| | | | | | | | ||
| | | | | | | | ||
| | | | | | | | ||
| | ||||||||
| | | | | 31 | | | ||
| | ||||||||
| | | | ||||||
| | ||||||||
| | | |||||||
| | | | | | 33 | | | |
| | ||||||||
| | | | | 35 | | | ||
| | | | | | 35 | | ||
| | | | | 40 | | |||
| | | | | | | | ||
| | | | | | | | ||
| | | | | | | | ||
| | | | | | | | ||
| | | | | | 43 | | | |
| | | | | | 44 | | | |
| | | | | | 44 | | | |
| | | | | | 44 | | | |
| | | | | | 45 | | |
20182021 Proxy Statement i
| | ||||||||
| | | | | | | |||
| | | | | | | | ||
| | | | | | | | ||
| | | | | | | | ||
| | | | | | 56 | | ||
| | | | | | | | ||
| | ||||||||
| | | | ||||||
| | ||||||||
| | | |||||||
| | | | | | 57 | | | |
| | | | | | 57 | | | |
| | | | | | 58 | | | |
| | | | | | | | ||
| | | | | | 60 | | ||
| | | | | | 61 | | ||
| | | | | | 62 | | ||
| | | | | | 62 | | ||
| | | | | | 64 | | ||
| | | | | | | | ||
| | | | | | | | ||
| | ||||||||
| | | |||||||
| | | 69 | | | ||||
| | ||||||||
| | | | | | | |||
| | | | | | | | ||
| | ||||||||
| | | |||||||
| | | 72 | | | ||||
| | | | | | | | ||
| | | | | | 74 | | | |
| | ||||||||
| | | | | 74 | | | ||
| | QUESTIONS AND ANSWERS ABOUT THE ANNUAL MEETING AND VOTING | | ||||||
| | | | | |||||
|
paper copy of this proxy statement, our 20172020 Annual Report, and a form of proxy or voting instruction card isare first being mailed or made available to shareholders on or about March 23, 2018.
| | | Annual Meeting of Shareholders | | | ||||||||
| | | Time and Date: | | | ||||||||
10:30 a.m., Eastern Time, on Wednesday, May | | |||||||||||
| ||||||||||||
| | | | | Online at: http://www.meetingcenter.io/258120406 Enter the 15-digit control number on the Proxy Card and Password: ES2021 | | | ||||||
| | | Record Date: | | | March 10, 2021 | | | |||||
| | Financial | | | Operational | | | Sustainability/ESG | |
| | • 2020 earnings per share equaled $3.55, and non-GAAP earnings per share equaled $3.64, which excludes transactional costs relating to the successful acquisition of the assets of Columbia Gas of Massachusetts. • Our Board of Trustees increased the annual dividend rate by 6.1 percent for 2020 to $2.27 per share, exceeding the Edison Electric Institute (EEI) Index companies’ median dividend growth rate of 4.5 percent. • Our Total Shareholder Return in 2020 was 4.5 percent, compared to negative 1.2 percent for the EEI Index companies. • We made progress in our Revolution Wind and Sunrise Wind offshore wind projects and are otherwise continuing to advance our clean energy financial opportunities through our offshore wind energy partnership with Ørsted. • Our Standard & Poor’s credit rating is A-. There is no other holding company in the EEI Index with a higher credit rating. | | | • On average, 2020 customer power interruptions were 19.2 months apart, and average service restoration time was 64 minutes, as calculated pursuant to industry standards; this performance ranks us in the top decile of the industry. • We met our 2020 established goals in safety performance, outperforming the utility industry, and in response to gas service calls. • We achieved constructive regulatory outcomes at both the state and federal levels. • We continued to add to our customer messaging programs, led the industry in the early implementation of customer service moratoria in response to the pandemic, implemented extended customer forgiveness and payment programs, and set up a dedicated team to help small business customers apply for COVID-19 related federal assistance. | | | • Progress on our carbon neutral goal by 2030, as well as the energy efficiency, offshore wind, large-scale solar installation, battery storage and electric vehicle infrastructure programs and initiatives we describe in this proxy statement have significantly advanced our long-term strategy of being a clean energy leader. • Our 2021 Trustee nominees include nine who have served on the Board for nine or fewer years, three who are women and four who are persons of color. • We were again recognized by a significant number of organizations for our leadership in energy efficiency, veteran and differently-abled person hiring, workplace diversity, investor relations, and ESG. • We continued our strong support of our communities through our corporate philanthropy and employee volunteer programs. • Our Corporate Governance Committee has been renamed the Governance, Environmental and Social Responsibility Committee, to reflect new charter responsibilities relating to all aspects of ESG. | |
|
|
was
| | | | | | | | | | | | | | | | | | | | | | | Board Committees | | |||||||||||||||||||||||||||
| | Trustee | | | Age | | | Trustee Since | | | Independent | | | Audit | | | Compensation | | | Governance, Environmental and Social Responsibility | | | Executive | | | Finance | | ||||||||||||||||||||||||
| | Cotton M. Cleveland | | | | | 68 | | | | | | 1992 | | | | | | Y | | | | | | | | | | | | | | | | | | C | | | | | | M | | | | | | M | | |
| | James S. DiStasio | | | | | 73 | | | | | | 2012 | | | | | | Y | | | | | | | | | | | | M | | | | | | | | | | | | M | | | | | | C | | |
| | Francis A. Doyle | | | | | 72 | | | | | | 2012 | | | | | | Y | | | | | | C | | | | | | M | | | | | | | | | | | | M | | | | | | | | |
| | Linda Dorcena Forry | | | | | 47 | | | | | | 2018 | | | | | | Y | | | | | | | | | | | | | | | | | | M | | | | | | | | | | | | M | | |
| | Gregory M. Jones | | | | | 63 | | | | | | 2020 | | | | | | Y | | | | | | M | | | | | | | | | | | | | | | | | | | | | | | | M | | |
| | James J. Judge | | | | | 65 | | | | | | 2016 | | | | | | N | | | | | | | | | | | | | | | | | | | | | | | | C | | | | | | | | |
| | John Y. Kim | | | | | 60 | | | | | | 2018 | | | | | | Y | | | | | | M | | | | | | M | | | | | | | | | | | | | | | | | | | | |
| | Kenneth R. Leibler | | | | | 72 | | | | | | 2006 | | | | | | Y | | | | | | M | | | | | | | | | | | | | | | | | | | | | | | | M | | |
| | David H. Long | | | | | 60 | | | | | | 2019 | | | | | | Y | | | | | | | | | | | | M | | | | | | M | | | | | | | | | | | | | | |
| | William C. Van Faasen | | | | | 72 | | | | | | 2012 | | | | | | Y | | | | | | | | | | | | C | | | | | | M | | | | | | M | | | | | | | | |
| | Frederica M. Williams | | | | | 62 | | | | | | 2012 | | | | | | Y | | | | | | M | | | | | | | | | | | | M | | | | | | | | | | | | | | |
| | | | | Board Committees | ||||||||||||
|---|---|---|---|---|---|---|---|---|---|---|---|---|---|---|---|---|
| Trustee | Age | Trustee Since | Independent | Audit | Compensation | Corporate Governance | Executive | Finance | ||||||||
| | | | | | | | | | | | | | | | | |
Cotton M. Cleveland | 65 | 1992 | Y | | | M | | M | ||||||||
Sanford Cloud, Jr. * | 73 | 2000 | Y | M | C | M | ||||||||||
James S. DiStasio | 70 | 2012 | Y | | M | | M | C | ||||||||
Francis A. Doyle | 69 | 2012 | Y | C | M | M | ||||||||||
James J. Judge | 62 | 2016 | N | | | | C | | ||||||||
John Y. Kim | 57 | 2018 | Y | M | M | |||||||||||
Kenneth R. Leibler | 69 | 2006 | Y | M | | | | M | ||||||||
William C. Van Faasen | 69 | 2012 | Y | M | M | |||||||||||
Frederica M. Williams | 59 | 2012 | Y | M | | | | M | ||||||||
Dennis R. Wraase | 73 | 2010 | Y | M | M | |||||||||||
| | | | | | | | | | | | | | | | | |
2018 Proxy Statement �� 1
|
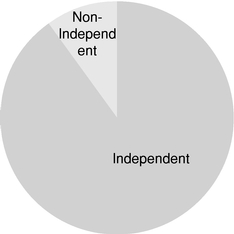
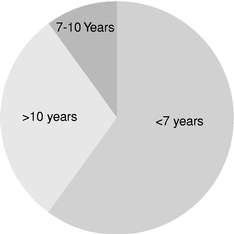
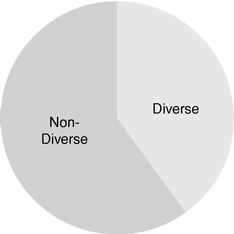
Independence, Tenure and Diversity
Of our eleven nominees, ten nominees, sixare independent, nine have served on the Board for sevennine or fewer years, three are women, and four are women and/or persons of color, and nine are independent.color. Please see the sections
marked "Selection in Item 1 Election of Trustees," "Trustee under the captions
 |  |  |
|
We are asking shareholders to approve the compensation of the Company'sCompany’s Named Executive Officers, as disclosed pursuant to the compensation disclosure rules of the Securities and Exchange Commission (SEC). WeAs noted in the Summary of 2020 Accomplishments and elsewhere in this proxy statement, we achieved excellent financial and operating performance results in 2017,2020, and our total shareholder return hascontinues to consistently outperformed outperform
We met or exceeded challenging goals established for 2017 and achieved very positive results, including:
2 2018 Proxy Statement
|
We are asking shareholders to approve the 2018 Eversource Energy Incentive Plan (2018 Plan). Our Board of Trustees and our Compensation Committee approved the 2018 Plan, subject to shareholder approval. Grants under the 2018 Plan will not become effective unless and until the 2018 Plan is approved by our shareholders. The material features of the 2018 Plan are
described under "Summary of the 2018 Plan" in Item 3 on pages 63 - 68.
Our Board believes that the 2018 Plan will promote the interests of our shareholders and is consistent with principles of good corporate and executive compensation governance. Please see pages 63 - 68 andAppendix A.
|
Our Audit Committee has selected Deloitte & Touche LLP to serve as our independent registered public accounting firm for the year ending December 31, 2018.2021. The Board is seeking shareholder ratification of this selection. Please see pages 69 - 71.
The Board of Trustees recommends that shareholders vote FOR Items 1, 2, 3 and 4.
|
In 2017, we continued to achieve very positive financial and operational performance results. The following are highlights of some of our most important accomplishments in 2017:
2017 Financial Summary
2017 Operational Summary
2018 Proxy Statement 3
| | The Board of Trustees recommends that shareholders vote FOR Items 1, 2 and 3. | | |
|
What we DO:
What we DON'T do:
4 20182021 Proxy Statement
|
Eastern Time.
“FOR” or "AGAINST" the“AGAINST” a nominee or item or you may abstain from voting on the item.
20182021 Proxy Statement 5
TableItem 1: Election of ContentsTrustees
|
“Selection of Trustees", "TrusteesTrustees,” “Trustee Qualifications, Skills and Experience"Experience” and "Evaluation“Evaluation of the Board and Board Refreshment"Refreshment” beginning on page 12.13. Each nominee has indicated to our Lead Trustee that he or shethey will stand for election and will serve as a Trustee if elected. The affirmative vote of the holders of a majority of the common shares outstanding as of the record date will be required to elect each nominee. This means that each nominee must receive the affirmative vote of the holders of more than 50%50 percent of the total common shares outstanding. You may either vote "FOR"“FOR” or "AGAINST"“AGAINST” all, some, or none of the Trustees, or you may abstain from voting. Broker non-votes and abstentions will be counted in the determination of a quorum and will have the same effect as a vote against a nominee.
The Board of Trustees recommends that shareholders vote FOR the election of the nominees listed below.
| | | The Board of Trustees recommends that shareholders vote FOR the election of the nominees listed below. | | |
![[MISSING IMAGE: ph_cottoncleveland-bwresized.jpg]](https://capedge.com/proxy/DEF 14A/0001104659-21-042415/ph_cottoncleveland-bwresized.jpg)

Cotton M. Cleveland
![[MISSING IMAGE: ph_jamesdistasio-bwresized.jpg]](https://capedge.com/proxy/DEF 14A/0001104659-21-042415/ph_jamesdistasio-bwresized.jpg)
BACKGROUND
Mr. Cloud has been Chairman and Chief Executive Officer of The Cloud Company, LLC, a real estate development and business investment firm, since 2005. Mr. Cloud served as past President and Chief Executive Officer of the National Conference for Community and Justice from 1994 to 2004, was a former partner at the law firm of Robinson and Cole from 1993 to 1994, and served for two terms as a state senator of Connecticut. He was Vice President of Corporate Public Involvement and Executive Director of the Aetna Foundation from 1986 to 1992 and has served as Chairman of the Connecticut Health Foundation and continues as a member of its Board. Mr. Cloud served as a director of The Phoenix Companies, Inc. from 2001 to 2016 and is currently a director of Ironwood Mezzanine Fund, L.P. He is also a director of the MetroHartford Alliance, Inc. and the University of Connecticut Health Center. In addition, Mr. Cloud is a member of the Board of Trustees of the University of Connecticut and serves as director of its Thomas J. Dodd Center for Human Rights. Mr. Cloud received a B.A. degree from Howard University, a J.D. degree cum laude from the Howard University Law School, and an M.A. degree in Religious Studies from the Hartford Seminary.
QUALIFICATIONS, SKILLS AND EXPERIENCE
Mr. Cloud has significant policy-making level experience in business and financial affairs as a business executive and as a director of several publicly-traded and privately-held companies. He provides the Board with great benefits from his experience as a law firm partner and Connecticut state senator and through his significant ties and service to the City of Hartford and the State of Connecticut. Based on these qualifications, skills and experience, the Board of Trustees determined that Mr. Cloud should continue to serve as a Trustee.
2018 Proxy Statement 7
|

James S. DiStasio
![[MISSING IMAGE: ph_francisdoyle-bwresized.jpg]](https://capedge.com/proxy/DEF 14A/0001104659-21-042415/ph_francisdoyle-bwresized.jpg)
Francis A. Doyle
![[MISSING IMAGE: ph_lindaforry-bwresized.jpg]](https://capedge.com/proxy/DEF 14A/0001104659-21-042415/ph_lindaforry-bwresized.jpg)
TableItem 1: Election of ContentsTrustees
![[MISSING IMAGE: ph_gregjones-bwresized.jpg]](https://capedge.com/proxy/DEF 14A/0001104659-21-042415/ph_gregjones-bwresized.jpg)

![[MISSING IMAGE: ph_jamesjudge1-bwresized.jpg]](https://capedge.com/proxy/DEF 14A/0001104659-21-042415/ph_jamesjudge1-bwresized.jpg)
![[MISSING IMAGE: ph_johnkim1-bwresized.jpg]](https://capedge.com/proxy/DEF 14A/0001104659-21-042415/ph_johnkim1-bwresized.jpg)

John Y. Kim
![[MISSING IMAGE: ph_kennethrleiblerk-bwrz.jpg]](https://capedge.com/proxy/DEF 14A/0001104659-21-042415/ph_kennethrleiblerk-bwrz.jpg)
2018 Proxy Statement 9
|
Kenneth R. Leibler
![[MISSING IMAGE: ph_longdavid-bwresized.jpg]](https://capedge.com/proxy/DEF 14A/0001104659-21-042415/ph_longdavid-bwresized.jpg)

![[MISSING IMAGE: ph_williamvanfaasen-bwrz.jpg]](https://capedge.com/proxy/DEF 14A/0001104659-21-042415/ph_williamvanfaasen-bwrz.jpg)
10 20182021 Proxy Statement
![[MISSING IMAGE: ph_fredericawilliams1-bwrz.jpg]](https://capedge.com/proxy/DEF 14A/0001104659-21-042415/ph_fredericawilliams1-bwrz.jpg)

Frederica M. Williams
Dennis R. Wraase
BACKGROUND
Mr. Wraase served as Chairman of the Board, Chief Executive Officer and a director of Pepco Holdings, Inc. (PHI), an energy delivery company in the mid-Atlantic region, until his retirement in June 2009. He was elected chairman of PHI in 2004, became Chief Executive Officer in 2003 and served as a director from 1998 to his retirement. He previously served as the President of PHI from 2001 to 2008 and Chief Operating Officer from 2002 to 2003. He is a member of the Financial Executives Institute and the American Institute of Certified Public Accountants. Mr. Wraase currently serves as the Executive-In-Residence at the Center for Social Value Creation at the Robert H. Smith School of Business, University of Maryland. He is also currently a director of the University of Maryland System Foundation. Mr. Wraase previously served as director of the Edison Electric Institute, The Association of Edison Illuminating Companies and the Institute for Electric Efficiency, and as the President of the Southeastern Electric Exchange. Mr. Wraase received a B.S. degree in Accounting from the University of Maryland and an M.S. degree in Business Financial Management from The George Washington University.
QUALIFICATIONS, SKILLS AND EXPERIENCE
Mr. Wraase brings to the Company considerable utility industry knowledge and experience gained through his career of service at PHI. He has significant policy-making level experience in regulated businesses as well as in capital and financial markets, credit markets, financial reporting and accounting, and risk assessment. He is also a certified public accountant. Based on these qualifications, skills and experience, the Board of Trustees determined that Mr. Wraase should continue to serve as a Trustee.
2018 Proxy Statement 11
|
|
James J. Judge is our Chairman, President and Chief Executive Officer. Sanford Cloud, Jr.William C. Van Faasen serves as our Lead Trustee.
the Board members; participates with the Compensation Committee, which he Chairs, in its evaluation of the Chief Executive Officer; and provides ongoing information to the Chief Executive Officer about his or her performance. He also attends all Committee meetings.
|
| | | Trustees should possess the highest personal and professional ethics, integrity and values, and be committed to representing the long-term interests of our shareholders. They must also have an inquisitive and objective perspective, practical wisdom and mature judgment. The Board should represent diverse experience at policy-making levels in business, government, education, community and charitable organizations, as well as areas that are relevant to our business activities. The Governance, Environmental and Social Responsibility Committee also seeks diversity in gender, ethnicity and personal background when considering Trustee candidates. | | |
Trustees should possess the highest personal and professional ethics, integrity and values, and be committed to representing the long-term interests of our shareholders. They must also have an inquisitive and objective perspective, practical wisdom and mature judgment. The Board should represent diverse experience at policy-making levels in business, government, education, community and charitable organizations, as well as areas that are relevant to our business activities. The Corporate Governance Committee also seeks diversity in gender, ethnicity and personal background when considering Trustee candidates.
Applying these criteria and those noted elsewhere in this proxy statement, the Corporate Governance, Environmental and Social Responsibility Committee considers Trustee
acting on the recommendation of the Corporate Governance Committee, the Board of Trustees elected John Y. Kim to the Board effective January 1, 2018.
As part of the annual nomination process, for re-election, the Corporate Governance, Environmental and Social Responsibility Committee reviews the independence, qualifications, experience, attributesskills and skillsexperience of each nominee for Trustee and reports its findings to the Board. At its February 7, 20189, 2021 meeting, the Corporate Governance, Environmental and Social Responsibility Committee and the Board of Trustees determined that each Trustee (except our Chief Executive Officer) is independent, that each Trustee possesses the highest personal and professional ethics, integrity and values, and that each Trustee remains committed to representing the long-term interests of our shareholders. The Committee'sCommittee’s review also focused on each Trustee'sTrustee’s experience at policy-making levels in business, government, education, community and charitable organizations, and other areas relevant to our business activities, as described below. Based on this review, the Committee advised the Board on February 7, 20189, 2021 that each of the Trustees was qualified to serve on the Board under the Corporate Governance Guidelines.
12 20182021 Proxy Statement
Trustee Qualifications, Skills and Experience |
|
Regulatory Experience. Each of our utility subsidiaries is regulated in virtually all aspects of its business by various federal and state agencies, including the SEC, the Federal Energy Regulatory Commission, and various state and/or local regulatory authorities with jurisdiction over the industry and the service areas in which each subsidiary operates. Accordingly, the Board values the policy-making level experience in a heavily regulated industry that several of our Trustees possess.
Accounting Experience.. As a publicly-traded electric, gas and water holding company whose companies are subject to very substantial federal, state and accounting industry rules, it is especially important that the Board have significant accounting experience. Accurate and complete financial reporting, financing, auditing and internal controls are critical to our success. We expect all of our Trustees to be literate in financial statements and financial reporting processes. Several of our
Trustees are career accounting and financial executives andwho provide us with superior strength in the Board'sBoard’s oversight of this important element of the Board'sBoard’s responsibilities.
Finance Experience. The vast majority of our ongoing capital program is expected to be funded through cash flows provided by operating activities as well as new debt issuances and, less frequently, equity issuances. As a result, the Board highly values the policy-making level experience and understanding of capital and financial markets, accounting and financial reporting, and credit markets that many of our Trustees have acquired.
Education/Community and Charitable Organization Involvement. Public utility companies have a unique position and role in the communities they serve beyond
2018 Proxy Statement 13
|
thatGovernance of most corporations. The Board supports and encourages educational opportunities, community involvement and development, and philanthropic goals and activities. The Eversource Energy Foundation, Inc. was established in 1998 to focus on our community investments
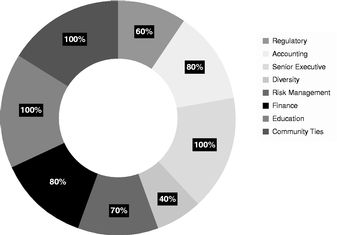
![[MISSING IMAGE: tm212409d1-pc_skillscir4clr.jpg]](https://capedge.com/proxy/DEF 14A/0001104659-21-042415/tm212409d1-pc_skillscir4clr.jpg)
Community Ties.Tenure We operate New England's largest energy delivery system in three different states. Because a majority of our Trustees also reside in our service territory, they not only have ties to local communities, but they understand our customers' needs.
Our Board's Qualifications, Skills and Experience
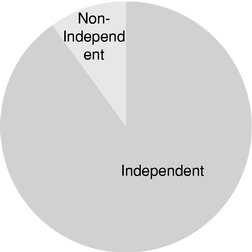
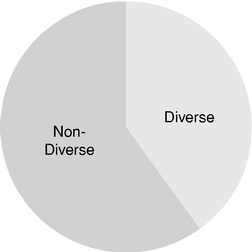
Independence, Tenure and Diversity
Of our eleven nominees, ten nominees, sixare independent, nine have served on the Board for sevennine or fewer years, three are women and four are women and/or persons of color,color. We believe that the mix of longer-tenured Trustees and nine are independent.

14 2018 Proxy Statement
| ![[MISSING IMAGE: tm212409d1-pc_independbw.jpg]](https://capedge.com/proxy/DEF 14A/0001104659-21-042415/tm212409d1-pc_independbw.jpg) | | | ![[MISSING IMAGE: tm212409d1-pc_ethniebw.jpg]](https://capedge.com/proxy/DEF 14A/0001104659-21-042415/tm212409d1-pc_ethniebw.jpg) | |
| ![[MISSING IMAGE: tm212409d1-pc_genderbw.jpg]](https://capedge.com/proxy/DEF 14A/0001104659-21-042415/tm212409d1-pc_genderbw.jpg) | | | ![[MISSING IMAGE: tm212409d1-pc_tenurebw.jpg]](https://capedge.com/proxy/DEF 14A/0001104659-21-042415/tm212409d1-pc_tenurebw.jpg) | |
Board also annually review the independence, performance and qualifications of each Trustee prior to nominations being made for an additional term. These reviews are discussed by the Committee, following which it makes recommendations to the Board regarding nominees for election as Trustees.
Our Board has an average tenure of nine years. We believe that the mix of longer tenured Trustees and recently elected Trustees provides for the kind of balance that contributes to the overall effectiveness of the Board, and that strict restrictions on the length of time a Trustee serves on the Board are not warranted.
|
The Corporate Governance Guidelines are available on our website at the Internet address appearing in the Trustee Independence section on page 24. The committee charters are available on our website at the Internet addresses appearing in the committee descriptions below. Copies of these documents are available to any shareholder upon written request to our Secretarycommittees. These charters can be found at the address set forth on page 72 of this proxy statement. The functions of these Committees are described in the paragraphs following the table. The table below shows the current committee membership:
2018 Proxy Statement 15
|
|
| ||||||||||
| | ||||||||||
Members: | ||||||||||
| ||||||||||
| ||||||||||
| ||||||||||
Francis A. Doyle, Chair | ||||||||||
| ||||||||||
| ||||||||||
| ||||||||||
| ||||||||||
| ||||||||||
| ||||||||||
| ||||||||||
| ||||||||||
| | | | The Audit Committee is responsible for oversight of the Company’s financial statements, the internal audit function, and compliance by the Company with legal and regulatory requirements. The Committee also oversees: • The appointment, compensation, retention and oversight of our independent registered public accounting firm. • The independent registered public accounting firm’s qualifications, performance and independence, as well as the performance of our internal audit function. • The review of guidelines and policies that govern management’s processes in assessing, monitoring and mitigating major financial risk exposures. • Financial reporting and review of accounting standards and systems of internal control. • Significant accounting policies, management judgments and accounting estimates, and earnings releases. The Audit Committee has sole authority to appoint or replace the independent registered public accounting firm (for which it seeks shareholder ratification), and to approve all audit engagement fees and terms. The Committee meets independently with the internal audit staff, the independent registered public accounting firm, management, and then solely as a Committee, at least quarterly. Following each Committee meeting, the Audit Committee reports to the full Board. The Audit Committee met six times during 2020, including the annual joint meeting with the Finance Committee. Additional information regarding the Audit Committee is contained in Item 3 of this proxy statement beginning on page 71. Financial Expertise: Each member of the Audit Committee meets the financial literacy requirements of the New York Stock Exchange (NYSE), the SEC and our Corporate Governance Guidelines. The Board has affirmatively determined that Mr. Doyle is an “audit committee financial expert,” as defined by the SEC. Independence: The Board has determined that each member of the Audit Committee meets the independence requirements of the NYSE, SEC and our Corporate Governance Guidelines. | | |
| | | Members: William C. Van Faasen, Chair James S. DiStasio Francis A. Doyle John Y. Kim David H. Long | | | | The Compensation Committee is responsible for the compensation and benefit programs for all executive officers of Eversource Energy and has overall authority to establish and interpret our executive compensation programs. The Compensation Committee also: • Reviews our executive compensation strategy, evaluates components of total compensation, and assesses performance against goals, market competitive data and other appropriate factors, and makes compensation-related decisions based upon Company and executive performance. • Reviews and recommends to the Board of Trustees the compensation of the non-employee members of the Board. • Reviews and approves corporate goals and objectives relevant to the Chief Executive Officer’s compensation and, with the participation of the Lead Trustee and subject to the further review and approval of the independent Trustees, evaluates the performance of the Chief Executive Officer in light of those goals and objectives. • In collaboration with the Chief Executive Officer, oversees the evaluation of executive officers and engages in the succession planning process for the Chief Executive Officer and other executives. • Has the sole authority to select and retain experts and consultants in the field of executive compensation to provide advice to the Committee with respect to market data, competitive information, and executive compensation trends. • Retains an independent compensation consulting firm to provide compensation consulting services solely to the Compensation Committee. Following each Committee meeting, the Compensation Committee reports to the full Board. The Compensation Committee met four times during 2020. For additional information regarding the Compensation Committee, including the Committee’s processes for determining executive compensation, see the CD&A beginning on page 35. Independence: The Board has affirmatively determined that each member of the Compensation Committee meets the independence requirements of the NYSE, the SEC, and our Corporate Governance Guidelines. | | |
| | | Members: James J. Judge, Chair Cotton M. Cleveland James S. DiStasio Francis A. Doyle William C. Van Faasen | | | | The Executive Committee is empowered to exercise all the authority of the Board, subject to certain limitations set forth in our Declaration of Trust, during the intervals between meetings of the Board. Following each Committee meeting, the Executive Committee reports to the full Board. The Executive Committee did not meet in 2020. Independence: Except for Mr. Judge, who is the Company’s Chairman, President and Chief Executive Officer, each member of the Executive Committee is independent. | | |
| | Members: James S. DiStasio, Chair Cotton M. Cleveland Linda Dorcena Forry Gregory M. Jones Kenneth R. Leibler | | | | The Finance Committee assists the Board in fulfilling its oversight responsibilities relating to financial plans, policies and programs for Eversource Energy and its subsidiaries. The Finance Committee also: • Reviews the Company’s plans and actions to assure liquidity; its financial goals and proposed financing programs modifying the Company’s capital structure; its financing programs, including but not limited to the issuance and repurchase of common and preferred shares, long-term and short-term debt securities and the issuance of guarantees; and its operating plans, budgets and capital expenditure forecasts. • Reviews the Company’s Enterprise Risk Management (ERM) program and in conjunction with other Committees of the Board, practices to monitor and mitigate cyber, physical security and other risk exposures. • Reviews and recommends the Company’s dividend policy, as well as new business ventures and initiatives which may result in substantial expenditures, commitments and exposures. • Conducts an annual review of counter-party credit policy, insurance coverages and pension plan performance. Following each Committee meeting, the Finance Committee reports to the full Board. The Finance Committee met four times during 2020, including the annual joint meeting with the Audit Committee. Independence: Each member of the Finance Committee is independent, and while the Committee is not specifically subject to NYSE or SEC independence regulations, each member meets the independence criteria set forth in the NYSE and SEC regulations and our Corporate Governance Guidelines. | | |
The Audit Committee consists of Mr. Clarkeson, Mr. Doyle (Chair), Mr. Kim, Mr. Leibler, Mr. Van Faasen and Ms. Williams. The Audit Committee meets independently with the internal audit staff, the independent registered public accounting firm and management at least quarterly.
Following each Committee meeting, the Audit Committee reports to the full Board. The Audit Committee reviews and evaluates the independent registered public accounting firm's activities, procedures and recommendations to assist the Board in monitoring the integrity of our financial statements, the independent registered public accounting firm's qualifications and independence, the performance of our internal audit function and independent registered public accounting firm, and our compliance with legal and regulatory requirements. The Committee periodically discusses the guidelines and policies that govern management's processes for assessing, monitoring and mitigating major financial risk exposures. The Audit Committee also reviews the Company's significant accounting policies, management judgments and accounting estimates, earnings releases, financial statements and systems of internal control. The
Audit Committee has the sole authority to select and replace the independent registered public accounting firm and is directly responsible for their compensation and Board oversight of their work. Each member of the Audit Committee meets the financial literacy requirements of the New York Stock Exchange (NYSE), the SEC and our Corporate Governance Guidelines. The Board has affirmatively determined that Mr. Doyle is an "audit committee financial expert," as defined by the SEC. Each member of the Audit Committee also meets the independence requirements of the NYSE, SEC and our Corporate Governance Guidelines. No member of the Audit Committee is employed by Eversource Energy or its subsidiaries. Additional information regarding the Audit Committee is contained in Item 4 of this proxy statement. A copy of the Committee's charter is available on our website at www.eversource.com/Content/general/about/investors/corporate-governance/board-committee-charters/audit-committee. The Audit Committee met five times during 2017, and also met once with the Finance Committee in a meeting held in April 2017 at which the Committees discussed several issues relating to risk, and in particular, enterprise, cyber and system security risk.
16 20182021 Proxy Statement
|
The Compensation Committee consists of Mr. Clarkeson, Mr. Cloud, Mr. DiStasio, Mr. Gifford (Chair), Mr. Kim, Mr. Van Faasen and Mr. Wraase. The Compensation Committee is responsible for the compensation and benefit programs for all executive officersGovernance of Eversource Energy
| | | Members: Cotton M. Cleveland, Chair Linda Dorcena Forry David H. Long William C. Van Faasen Frederica M. Williams | | | | The Governance, Environmental and Social Responsibility Committee is responsible for developing, overseeing and regularly reviewing our Corporate Governance Guidelines and related policies. The Governance, Environmental and Social Responsibility Committee also: • Serves as a nominating committee, establishing criteria for new Trustees and identifying and recommending prospective Board candidates and the appointment of Trustees to Board Committees. • Annually reviews the independence and qualifications of the Trustees and recommends to the Board appointments of the Committee Members, of the Lead Trustee, and the Chairman of the Board and the election of officers of the Company. • Annually evaluates the performance of the Board and its Committees. • Annually reviews the charters of the Board Committees. • Oversees the Company’s ESG, sustainability, and social responsibility strategy, programs, policies, risks, and performance. Following each Committee meeting, the Governance, Environmental and Social Responsibility Committee reports to the full Board. The Governance, Environmental and Social Responsibility Committee met four times in 2020. Independence: The Board has affirmatively determined that each member of the Governance, Environmental and Social Responsibility Committee meets the independence requirements of the NYSE, the SEC, and our Corporate Governance Guidelines. | | |
In carrying out its charter responsibilities, the Compensation Committee reviews and approves corporate goals and objectives relevant to the Chief Executive Officer's compensation and, with the participation of the Lead Trustee and subject to the further review and approval of the independent Trustees, evaluates the performance of the Chief Executive Officer in light of those goals and objectives. The Committee establishes performance criteria for the Chief Executive Officer and approves the Chief Executive Officer's total compensation based on the annual evaluation, subject to further approval by the independent Trustees. In addition, in collaboration with
the Chief Executive Officer, the Committee oversees the evaluation of those executive officers who under the SEC's regulations are deemed "executives," and it engages in the succession planning process for the Chief Executive Officer and other executives.
The Compensation Committee has retained Pay Governance LLC to provide compensation consulting services. Pay Governance LLC has been engaged to perform work only for the Compensation Committee, and as noted in the Compensation Discussion and Analysis section of this proxy statement, the Compensation Committee has determined that Pay Governance LLC is independent and that no conflict of interest exists that would prevent Pay Governance LLC from independently advising the Committee.
The Compensation Committee has delegated some of its administrative responsibilities to the Chief Executive Officer and the Executive Vice President — Human Resources and Information Technology. The Compensation Committee has not delegated any of its responsibilities to any other persons. The Board has affirmatively determined that each member of the Compensation Committee meets the independence requirements of the NYSE, the SEC, and our Corporate Governance Guidelines. A copy of the Compensation Committee's charter is available on our website at www.eversource.com/Content/general/about/investors/corporate-governance/board-committee-charters/compensation-committee. The Compensation Committee met four times during 2017. The Compensation Committee reports to the full Board following each Committee meeting.
|
The Corporate Governance Committee consists of Ms. Cleveland, Mr. Cloud (Chair), Mr. Doyle, Mr. Gifford, Mr. La Camera and Mr. Wraase. The Corporate Governance Committee is responsible for developing, overseeing and regularly reviewing our Corporate Governance Guidelines and related policies. The Corporate Governance Committee also serves as a nominating committee, establishing criteria for new Trustees and identifying and recommending prospective Board candidates. The Corporate Governance Committee annually reviews the independence and qualifications of the Trustees, recommends nominees for election to the Board and for appointment to Board Committees, and annually recommends to the Board
appointments of the Lead Trustee and Chairman and the election of officers of the Company. In addition, the Corporate Governance Committee evaluates the performance of the Board and its committees. Following each meeting the Corporate Governance Committee reports to the full Board. No member of the Corporate Governance Committee is employed by Eversource Energy or its subsidiaries. The Board of Trustees has determined that each member of the Corporate Governance Committee meets the independence requirements of the NYSE, the SEC, and our Corporate Governance Guidelines. A copy of the Committee's charter is available on our website at
2018 Proxy Statement 17
|
www.eversource.com/Content/general/about/investors/corporate-governance/board-committee-charters/corporate-governance. The Corporate Governance Committee met six times during 2017.
|
The Executive Committee consists of Mr. Cloud, Mr. DiStasio, Mr. Doyle, Mr. Gifford and Mr. Judge (Chair). The Executive Committee is empowered to exercise all the authority of the Board, subject to certain limitations set forth in our Declaration of Trust, during the intervals between meetings of the Board. A copy of
the Committee's charter is available on our website at www.eversource.com/Content/general/about/investors/corporate-governance/board-commitee-charters/executive. The Executive Committee did not meet during 2017.
|
The Finance Committee consists of Ms. Cleveland, Mr. DiStasio (Chair), Mr. La Camera, Mr. Leibler and Ms. Williams. The Finance Committee assists the Board in fulfilling its fiduciary responsibilities relating to financial plans, policies and programs for Eversource Energy and its subsidiaries. The Finance Committee reviews the Company's plans and actions to assure liquidity; proposed financing programs; plans and recommendations regarding common share repurchase programs; early extinguishment and refunding of debt and preferred stock obligations; and other proposals that modify the Company's capital structure. The Finance Committee is responsible for reviewing the Company's Enterprise Risk Management (ERM) program, including practices to monitor and mitigate cyber, physical security and other risk exposures, as further described below under the caption "Board's Oversight of Risk." The Finance Committee is also responsible for
reviewing and recommending the Company's dividend policy, as well as new business ventures and initiatives which may result in substantial expenditures, commitments and exposures. In addition, the Finance Committee conducts an annual review of counter party credit policy, insurance coverages and pension plan performance. Following each meeting, the Finance Committee reports to the full Board. No member of the Finance Committee is employed by Eversource Energy or its subsidiaries. A copy of the Committee's charter is available on our website at www.eversource.com/Content/general/about/investors/corporate-governance/board-committee/charters/finance. The Finance Committee met four times during 2017, and also met once with the Audit Committee in April 2017, at which the Committees discussed several issues relating to risk, and in particular enterprise, cyber and system security risk.
|
No member of the Compensation Committee is employed by Eversource Energy or any of its subsidiaries. No executive officer of Eversource Energy serves as a member of the compensation committee or
on the board of
|
1820 20182021 Proxy Statement
TableGovernance of ContentsEversource Energy
Board’s Oversight of Risk |
|
planning session.
the Company, including compliance, auditing, and insurance, to ensure appropriate coverage of risks that could impact the Company.Company, that the appropriate risk response is determined, and that the risk mitigation plans are periodically reviewed. The top enterprise-wide risks are identified using a comprehensive cross functional analysis working with key officers and employees of each organization within the Company and are monitored throughout the year by the Company’s Risk
20182021 Proxy Statement 1921
TableGovernance of ContentsEversource Energy
|
|
addition, assessments by third-party experts of cyber and physical security risks to the utility industry and the Company in particular are provided periodically. The Company constantlyregularly reviews and updates its cyber and system security programprograms and the Board and its Committees continue to enhance their strong oversight activities, including joint meetings of the Audit and Finance Committees, at which cyber and system security programs and issues that might affect the Company'sCompany’s financial statements and operational systems can beare discussed by both Committees with financial, information technology, legal and accounting management, together withother members of the Board, representatives of the Company'sCompany’s independent registered public accounting firm, and other outside advisors.
|
Environmental,future generations, with environmental, social and governance (ESG) initiatives arefully integrated into the policies and principles that govern our Company and reflectCompany. One important example of our commitment to sustainable growth. We are committed to reliability, effective corporate governance, expanding energy options for our region, and environmental stewardship. Ourcontinued sustainability leadership includes setting a goal is to be the best energy companycarbon neutral in the nation, which includes being the leading clean energy utility and providing transparency and clarity about our position on these topics.
In 2017, we released Eversource's Commitment to Environmental Sustainability, which underscores our environmental priorities and highlights our roleoperations by 2030, while serving as a key catalyst for clean energy development in New England. This statement is an important componentThrough this leadership, we meet the sustainability and ESG expectations of our visionshareholders, customers, employees, regulators and the communities we serve. We are committed to top-tier reliability, superior customer service and effective corporate governance. We are continuously expanding energy options for how we conduct our business today; it is postedregion, have a best in the country energy efficiency program, implement best practices in human capital management and environmental stewardship, and provide transparency and clarity about our position and our performance on our website at www.eversource.com/content/ema-c/about/investors/investor-relations/sustainability-the-environment/commitment-to-environmental-sustainability. these topics. Our policies and programs have been recognized for their excellence throughout the industry and by independent trade groups, sustainability raters and the media.
with institutional investors. In December 2017, the nation's electric companies became the first industry
Set forth below isenabling a listcleaner mix of energy in the considerationsgrid and topics that we feel are important to our comprehensive Sustainability and Corporate Social Responsibility policies and practices, followed by a description of each and how we integrate them into our Company:
20 2018 Proxy Statement
Sustainability Governance. Sustainability reporting at Eversource is managed by a sustainability team, which is overseen by executive level management. Our team meets regularly throughout the year to assess current practices and identify improvement opportunities. All operational and business disciplines are engagedimproving efficiencies in our sustainability reporting process.
Electric Transmission. Since 2001, Eversource has sited and built complex and varied projects in densely populated, congested areas in our service territory. These projects have enhanced the reliability of the electric grid, eased congestion, accelerated retirement of older, higher emission coal and oil-fueled power plants, and helped to provide greater access to new, environmentally-friendly renewable power sources. Over the next four years, Eversource Energy plans to invest approximately $4.1 billion in projects and upgrades to modernize our electric transmission system and meet the region's renewable energy needs. A more reliable, more efficient electric grid will provide New England with the infrastructure that is critical to help the region meet its aggressive greenhouse gas reduction goals. If approved, our proposed $1.6 billion Northern Pass project will allow New England to import up to 1,090 megawatts of clean energy for 40 years beginning in late 2020.infrastructure.
Natural Gas. Our Distribution Integrity Management Programs are designed to improve service for our customers by mitigating potential risks and identifying and prioritizing operational and infrastructure enhancements. Replacement of aging natural gas infrastructure is an example of a top priority to minimize the potential for natural gas emissions and to prevent the release of greenhouse gases into the atmosphere. Over the past five years, we have doubled the pace at which we are replacing older natural gas pipelines in both Massachusetts and Connecticut.
Water. Aquarion Water Company provides water servicesones to residential, commercial, industrial, fire protectionfoster technological solutions to carbon reduction challenges.
annual production is self-supplied and processed at ten surface water treatment plants and numerous well stations, all wholly-owned and located in Connecticut, Massachusetts and New Hampshire.
Energy Efficiency. Delivering clean, efficient energy is oneexpect to grow over the coming decade can contribute significantly to reducing the carbon footprint of our primary goals.service territory and our 4.3 million customers. We are also committed to supporting regional goals addressing climate change. Our long-term strategy is rooted in being a principal catalyst for decarbonizing the grid with clean energy in New England. Our vision to lead our industry in sustainability includes investments in renewable energy sources, like wind and solar power — both of which will play an important role in our region’s clean energy future.
![[MISSING IMAGE: tm212409d1-fc_carbonbwlr.jpg]](https://capedge.com/proxy/DEF 14A/0001104659-21-042415/tm212409d1-fc_carbonbwlr.jpg)
Our nationally recognized energy efficiency portfolio of services provides energy solutions for all Eversource customers —customer classes: residential, (including low-income), municipal, commercial and industrial. These solutions address energy-efficient new construction, weatherization, lighting, appliances, heating, cooling, mechanical and process equipment replacement that go beyond code compliance and are transforming the marketplace. Combined with online customer engagement tools and on-site education, green-job training and community outreach services, energy efficiency is generating savings that go back into our region's economy. These investments are expected to
CorporateEversource Gas Company of Massachusetts. We are actively pursuing ways to incorporate responsible and Compensation Governance.renewable natural gas into our supply portfolio, which will help address customer concerns around environmental stewardship and decarbonization of the service we provide.
Our Employees. We are dedicatedadditional ways to ensuring that all ofleverage our employees receive good pay, are given the tools to perform their jobs safely, have access to affordable healthcare, and can look forward to a happy and comfortable retirement. We also are committed to diversitynatural gas assets in the workplace; Ceres recently commended usfuture for our progress and commitment to diversity, which includes linking executive compensation to increasing leadership-level position diversity.
2018 Proxy Statement 21
|
Our Communities.Water. Eversource is committed to the healthprotection of water resources through conservation, water quality management and economic well-beingwater saving technologies.
We have a long history of partnering with local and regional community organizations. Through grants, we support economic and community development, the environment, and initiatives that address local, high-priority concerns and needs. We provided nearly $16.1 million in grants to nonprofit organizations and worthwhile regional activities across our tri-state service area in 2017. We have strong partnerships with key community organizations across New England, including our continued support of the Eversource Walk for Boston Children's Hospital, the Eversource Hartford Marathon, the Eversource Walk and 5K Run for Easter Seals New Hampshire, the United Way, and Special Olympics.
Northeast by J.D. Power.
Climate Leadership. We have developed meaningful strategies to reduce our carbon footprint,critical resource areas and are proud
to be one of the greenest utilities in the nation. We are a founding partner of the EPA's Natural Gas STAR Methane Challenge Program,
Accountability. We hold ourselves accountable for the impact our business might have on the environment, meeting and in many cases exceeding all environmental laws, and regulatory commitments and requirements.
For additional information on these initiativesemotional pain caused by racism and injustice in our progress to date, you can access the Company's comprehensive sustainability report, which describes in greater detailsociety and know that our commitment to safety, reliability, expanding energy optionsDiversity and Inclusion (D&I) is critical to building an empowered and engaged team that delivers great service safely to our customers. It also calls for greater racial equity and social justice in our communities and workplaces. In 2020, Eversource updated its D&I strategy to include a Racial Equity and Social Justice Plan, with three areas of focus: building a more inclusive workplace, increasing leadership commitment, and further enhancing support for our region, environmental stewardshipdiverse communities and other objectives, throughminority suppliers. We communicated to our employees and stakeholders our commitments to developing a workforce that fully reflects the Company's website at www.eversource.com/content/ema-c/about/investors/investor-relations/sustainability-the-environment/sustainability.
22 2018 Proxy Statement
|
As part of our corporate governance program,the people and communities we engage with many of our institutional shareholders on corporate governance issues,serve. We continue to make progress year over year to become a more diverse and inclusive workplace; as shown in the data that we keep and track as part of our activeEEO-1 reporting compliance, in three years we have increased diversity leadership promotions and hires from 37% to 47.6%, workforce representation of diverse employees from 16% to 18.6%, and diversity slate of candidates from 50% to 57%. We have increased our emphasis on workforce representation of women, and although our progress has
![[MISSING IMAGE: tm212409d1-bc_esgbwlr.jpg]](https://capedge.com/proxy/DEF 14A/0001104659-21-042415/tm212409d1-bc_esgbwlr.jpg)
ESG practicespolicies, and our growing socially responsive investor base. The meetings included a dialogue between usaccomplishments; and the representatives of our shareholders on currentoverall corporate governance and executive compensation policies and practices; the sessions themselves vary according to the issues including proxy access,that are of greatest interest to our holders. Further information is available to all investors on our website in a presentation identified as “Eversource: A Sustainable Investment Opportunity.” Meeting topics have included enterprise risk, Board member refreshment, Board self-assessments, various governance-related provisions contained in our Declaration of Trust, Corporate Governance Guidelines, and Committee charters, stock incentive plan metrics, and general corporate
20182021 Proxy Statement
TableGovernance of ContentsEversource Energy
|
Eversource encourages its employees to be active members of their communities. Along with participation in civic, charitable and volunteer activities, this includes participation in the political process. Eligible employees
water service from any of the utility operating company subsidiaries of Eversource Energy in the ordinary course of business, on an arm'sarm’s length basis and pursuant to rates determined by the applicable public utility commission, are immaterial to the independence of the Trustees.
24 2018 Proxy Statement
completed by each Trustee and on reviews of all transactions involving the Company and all Related Persons conducted by both management and our independent registered public accounting firm, and after applying the NYSE Listing Standards and the Trustee
Independence Guidelines, the Board of Trustees determined that none of the Eversource Related Persons, including the Trustees, has a direct or indirect material interest in any transaction involving the Company or its subsidiaries.
2018 Proxy Statement 25
|
www.eversource.com/Content/docs/default-source/Investors/Code_of_business_conduct.Code_of_business_conduct. You may obtain a printed copy of the Code of Ethics and the Code of Business Conduct, without charge, by contacting our Secretary at the address set forth on page 7274 of this proxy statement. Any amendments to or waivers under the Code of Ethics or the Code of Business Conduct will be posted to our website atwww.eversource.com/Content/general/about/investors/corporate-governance.corporate- governance.
|
at the mailing address set forth on page 7274 of this proxy
2630 20182021 Proxy Statement
TableSecurities Ownership of ContentsCertain Beneficial Owners
|
The following table provides information as to persons who are known to us to beneficially own more than five percent of the common shares of Eversource Energy. We do not have any other class of voting securities.
| | Name and Address of Beneficial Owner | | | Amount and Nature of Beneficial Ownership | | | Percent of Class | | ||||||
| | The Vanguard Group, Inc. 100 Vanguard Blvd. Malvern, Pennsylvania 19355 | | | | | 40,913,941(1) | | | | | | 11.93%(1) | | |
| | BlackRock, Inc. 55 East 52nd Street New York, New York 10055 | | | | | 30,408,772(2) | | | | | | 8.9%(2) | | |
| | Magellan Asset Management Limited d/b/a MPG Asset Management MLC Centre, Level 36 19 Martin Place Sydney NSW 2021 Australia | | | | | 25,533,531(3) | | | | | | 7.45%(3) | | |
| | State Street Corporation State Street Financial Center One Lincoln Street Boston, MA 02111 | | | | | 19,603,630(4) | | | | | | 5.72%(4) | | |
| Name and Address of Beneficial Owner | Amount and Nature of Beneficial Ownership | Percent of Class | | |||||
|---|---|---|---|---|---|---|---|---|
| | | | | | | | | |
| The Vanguard Group, Inc. 100 Vanguard Blvd. Malvern, Pennsylvania 19355 | | 33,913,632 | (1) | | 10.7% | (1) | ||
BlackRock, Inc. 55 East 52nd Street New York, New York 10055 | 25,206,815 | (2) | 8.0% | (2) | ||||
| | | | | | | | | |
|
The table below shows the number of our common shares beneficially owned as of March 1, 2018,2021, by each of our Trustees and Named Executive Officers, as well as the number of common shares beneficially owned by all of our Trustees and executive officers as a group. We do not have any other class of voting securities. Together, these individuals beneficially own less than one percent of our outstanding common shares. The table also includes information about restricted share units and deferred shares credited to the accounts of our Trustees and executive officers under certain compensation and benefit plans. The address for the shareholders listed below is c/o Eversource Energy, 300 Cadwell Drive, Springfield, Massachusetts 01104.
| | ||||||||||||
| Name of Beneficial Owner | | | Amount and Nature of Beneficial Ownership(1)(2) | | ||||||||
|---|---|---|---|---|---|---|---|---|---|---|---|---|
| | Gregory B. Butler | | | | | 86,479(3) | | | ||||
| Cotton M. Cleveland | | ||||||||||
| ||||||||||||
| | | 67,054 | | ||||||||
| ||||||||||||
James S. DiStasio | | | 34,408 | | | |||||||
| Francis A. Doyle | |||||||||||
| | | 29,607(4) | | | |||||||
| Linda Dorcena Forry | | | | | 7,669 | | | ||||
| | Gregory M. Jones | | | | | 3,179 | | | ||||
| | James J. Judge | | | | 329,348(3) | | ||||||
| John Y. Kim | | | 23,349 | | | ||||||
| ||||||||||||
Kenneth R. Leibler | | | 42,870 | | | |||||||
| Philip J. Lembo | |||||||||||
| | | | 66,739(3)(5) | | |||||||
| David H. Long | | | | | 5,040 | | | ||||
| | Joseph R. Nolan, Jr. | | | | | 103,982(3) | | | ||||
| | Werner J. Schweiger | | | | 227,590(3)(6) | | ||||||
| William C. Van Faasen | | | 54,016 | | | ||||||
| Frederica M. Williams | |||||||||||
| | 20,916 | | | ||||||||
| All Trustees and Executive Officers as a group | |||||||||||
| | | | | 1,167,228(7) | | | ||||||
2832 20182021 Proxy Statement
|
Section 16(a) of the Securities Exchange Act of 1934 requires the Trustees and executive officers of Eversource Energy and persons who beneficially own more than ten percent of our outstanding common shares to file reports of ownership and changes in ownership with the SEC and the NYSE. We assist our Trustees and executive officers by monitoring
transactions and completing and filing Section 16 reports on their behalf. Based on such reports and the written representations of our Trustees and executive officers, we believe that for the year ended December 31, 2017, all such reporting requirements were complied with in a timely manner.
2018 Proxy Statement 29
|
The Compensation Committee periodically reviews the compensation of our non-employee Trustees and, when it deems appropriate and upon consultation with the Committee'sCommittee’s independent compensation consultant, recommends adjustments to be approved by the Board.Board of Trustees. The Compensation Committee recommends to the Board of Trustees compensation for the Trustees based on competitive market practices for both the total value of compensation and the allocation of cash and equity. The Committee uses data obtained from similarly sized utility and general industry companies as guidelines for setting Trustee compensation. The level of Trustee compensation recommended by the Committee and approved by the Board enables us to attract Trustees who have a broad range of backgrounds and experiences.
year, consisting of the number of restricted stock units (RSUs) resulting from
| | |||||
| Compensation Element | |||||
|---|---|---|---|---|---|
| | | Amount | | ||
| Annual Cash Retainer | | | $ | |
| Annual Stock Retainer | | | $ | |
| Board and Committee Attendance Fees | | | None | |
| Annual Lead Trustee Retainer | | | $ | |
| Annual Committee Chair Retainer | ||||
| |||||
| |||||
| |||||
| | | $25,000 Audit Committee $15,000 Compensation Committee $15,000 Governance, Environmental and Social Responsibility Committee $15,000 Finance Committee | |
Pursuant to the Company's Deferred Compensation Plan, priorPrior to the year earned, each Trustee may also irrevocably elect to defer receipt of all or a portion of their cash
30 20182021 Proxy Statement
| | Trustee | | | Fees Earned Or Paid in Cash ($)(1) | | | Stock Awards ($)(2) | | | Total ($) | | |||||||||
| | Cotton M. Cleveland | | | | $ | 125,000.00 | | | | | $ | 166,606.56 | | | | | $ | 291,606.56 | | |
| | Sanford Cloud, Jr.(3) | | | | | 80,000.00 | | | | | | 166,606.56 | | | | | | 246,606.56 | | |
| | James S. DiStasio | | | | | 130,000.00 | | | | | | 166,606.56 | | | | | | 296,606.56 | | |
| | Francis A. Doyle | | | | | 140,000.00 | | | | | | 166,606.56 | | | | | | 306,606.56 | | |
| | Linda Dorcena Forry | | | | | 115,000.00 | | | | | | 166,606.56 | | | | | | 281,606.56 | | |
| | Gregory M. Jones | | | | | 76,666.67 | | | | | | 115,361.84 | | | | | | 192,028.51 | | |
| | John Y. Kim | | | | | 115,000.00 | | | | | | 166,606.56 | | | | | | 281,606.56 | | |
| | Kenneth R. Leibler | | | | | 115,000.00 | | | | | | 166,606.56 | | | | | | 281,606.56 | | |
| | David H. Long | | | | | 115,000.00 | | | | | | 166,606.56 | | | | | | 281,606.56 | | |
| | William C. Van Faasen | | | | | 150,000.00 | | | | | | 166,606.56 | | | | | | 316,606.56 | | |
| | Frederica M. Williams | | | | | 115,000.00 | | | | | | 166,606.56 | | | | | | 281,606.56 | | |
Trustee | Fees Earned Or Paid in Cash ($)(1) | Stock Awards ($)(2) | Total ($) | |||||||
| | | | | | | | | | | |
John S. Clarkeson | | 100,000 | | 136,625.44 | | 236,625.44 | ||||
Cotton M. Cleveland | 100,000 | 136,625.44 | 236,625.44 | |||||||
Sanford Cloud, Jr. | | 140,000 | | 136,625.44 | | 276,625.44 | ||||
James S. DiStasio | 112,500 | 136,625.44 | 249,625.44 | |||||||
Francis A. Doyle | | 117,500 | | 136,625.44 | | 254,125.44 | ||||
Charles K. Gifford | 112,500 | 136,625.44 | 249,125.44 | |||||||
Paul A. La Camera | | 100,000 | | 136,625.44 | | 236,625.44 | ||||
Kenneth R. Leibler | 100,000 | 136,625.44 | 236,625.44 | |||||||
Thomas J. May(3) | | 50,000 | | 136,625.44 | | 186,625.44 | ||||
William C. Van Faasen | 100,000 | 136,625.44 | 236,625.44 | |||||||
Frederica M. Williams | | 100,000 | | 136,625.44 | | 236,625.44 | ||||
Dennis R. Wraase | 100,000 | 136,625.44 | 236,625.44 | |||||||
| | | | | | | | | | | |
20182021 Proxy Statement 31
|
follow.
| | |||
➢ Summary of 2020 Accomplishments ➢ Pay for Performance Philosophy | |||
➢ Executive Compensation Governance | |||
➢ Named Executive Officers | |||
➢ Overview of | |||
➢ Market Analysis | |||
➢ Mix of Compensation Elements ➢ Risk Analysis of Executive Compensation ➢ Results of 2020 Say on Pay Vote ➢ Elements of | |||
| | ➢ 2020 Annual Incentive Program | |
| ||||
| ||||
and Retention Requirements | ||||
➢ Contractual Agreements | ||||
➢ Tax and Accounting Considerations | ||||
➢ Equity Grant Practices ➢ Compensation Committee Report | |
|
2020:
32 2018 Proxy Statement
Set forth below is information relating to key financial metrics over the past three to five years:
Earnings Growth – 2015 - 2017 recurring2020 earnings per share have grown 5.5% on average, consistent with our long-term earnings guidanceequaled $3.55 per share, and above the utility industry average.
Recurringnon-GAAP earnings per share equaled $3.64; non-GAAP earnings excludes transactional costs relating to the highly successful acquisition in 2020 of the assets of Columbia Gas of Massachusetts (Columbia Gas).(1)
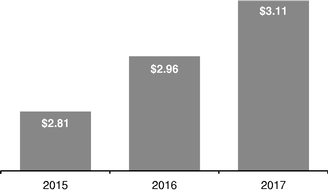
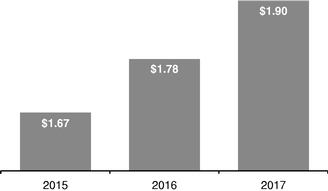
Dividend Growth – As a result of our continuing strong earnings growth, the The Board of Trustees increased the annual dividend rate by 6.7%6.1 percent for 20172020 to $1.90$2.27 per share, which exceedsexceeded the EEI Index companies' median dividend growth rate of 4.8%. The dividend growth rate4.5 percent for the period 2015 - 2017 has averaged 6.6%, well ahead ofutilities that constitute the utility industry average.Edison Electric Institute Index (EEI Utility Index).
![[MISSING IMAGE: tm212409d1-bc_dividendbwlr.jpg]](https://capedge.com/proxy/DEF 14A/0001104659-21-042415/tm212409d1-bc_dividendbwlr.jpg)
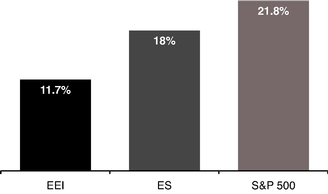
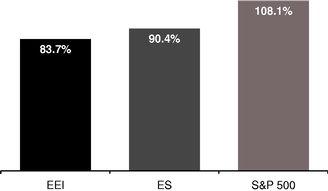
Total Shareholder Return – Our Total Shareholder Return (TSR) in 20172020 was 18%,4.5 percent, compared to the 11.7% growth ofnegative 1.2 percent for the EEI Index, companies and 21.8% for the S&P 500. We also outperformed5th highest TSR in the EEI Utility Index companiesof 39 companies. We have continued to outperform the EEI Utility Index over 2013 - 2017.the last one-, three-, five- and 10-year periods and the Standard & Poor’s 500 over the last three- and 10-year periods. An investment of $1,000 in our common shares atfor the beginning of the five-year10-year period beginning January 1, 20132011 was worth $1,904$3,726 on December 31, 2017.
2020. The following charts representchart represents the comparative one- and five-year total shareholder returns for the periods endingended December 31, 2017, respectively:
2020:
| | Total Shareholder Return | | | 2020 | | | 3-Year | | | 5-Year | | | 10-Year | | ||||||||||||
| | Eversource | | | | | 4.5% | | | | | | 49.4% | | | | | | 96.8% | | | | | | 272.6% | | |
| | EEI Index | | | | | -1.2% | | | | | | 28.9% | | | | | | 69.1% | | | | | | 190.0% | | |
| | S&P 500 | | | | | 18.4% | | | | | | 48.9% | | | | | | 103.0% | | | | | | 267.0% | | |
CREDIT RATING:Five-Year Cumulative Shareholder Return We continue to hold an A- level Corporate Credit Rating at Standard & Poor’s. There is no other holding company with a higher credit rating in the EEI Utility Index.
2017 Operational Accomplishments
![[MISSING IMAGE: tm212409d1-bc_reliabilbwlr.jpg]](https://capedge.com/proxy/DEF 14A/0001104659-21-042415/tm212409d1-bc_reliabilbwlr.jpg)
![[MISSING IMAGE: tm212409d1-bc_restorabwlr.jpg]](https://capedge.com/proxy/DEF 14A/0001104659-21-042415/tm212409d1-bc_restorabwlr.jpg)
![[MISSING IMAGE: tm212409d1-bc_safetybwlr.jpg]](https://capedge.com/proxy/DEF 14A/0001104659-21-042415/tm212409d1-bc_safetybwlr.jpg)
![[MISSING IMAGE: tm212409d1-bc_gasbwlr.jpg]](https://capedge.com/proxy/DEF 14A/0001104659-21-042415/tm212409d1-bc_gasbwlr.jpg)
2018 Proxy StatementEMPLOYEES/HUMAN CAPITAL MANAGEMENT: 33
|
Set forth below is information relating to key operational metrics over the past four years.
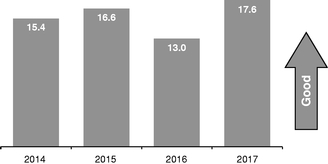
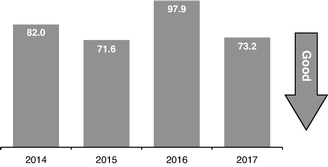
Reliability – Electric System Reliability, which is measured by months between interruptions and average time to restore power, wasbe included in the first quartile of our industry, with our best results ever for the lowest number and frequency of interruptions.
Reliability PerformanceMonths Between Interruptions
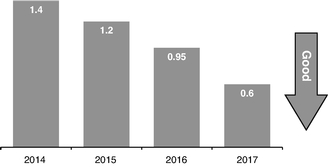
Safety performance, measured by DART per 100 workers, improved significantly; performance wasBloomberg Gender-Equality Index, which recognizes companies who have shown their commitment to advancing women’s equality in the first quartileworkplace and transparency in gender reporting.
indicators that address environmental, social and governance matters.Safety PerformanceDays Away or Restricted Time/100 Workers
|
executives in a manner that aligns compensation directly with performance. We strive to provide executives with base salary, performance-based annual incentive compensation, and performance-based long-term incentive compensation opportunities that are competitive with market practices and that reward excellent performance.
34 2018 Proxy Statement
| |
| | ||
What we DO: | ||
|
| |
|
| |
|
| |
|
| |
|
| |
|
| |
|
| |
| | ||
What we | ||
|
| |
|
| |
|
| |
|
| |
|
| |
reimburse the Company for incentive compensation received, not only if earnings wereare subsequently required to be restated as a result of noncompliance with accounting rules caused by fraud or misconduct, but also if there had beenfor a willful material violation of our Code of Business Conduct or materialsignificant breach of a material covenant in an employment agreement. The Plan also imposes limits on awards and on Trustee compensation and prohibits repricing of awards and liberal share recycling.
|
|
program for those senior executive officers, whom we refer to in this CD&A as "executives"“executives” and whom are deemed to be "officers"“officers” under the SEC'sSEC’s regulations
2018 Proxy Statement 35
|
that determine the persons whose compensation is subject to disclosure. In this role, the Committee sets compensation policy and compensation levels, reviews and approves performance goals and evaluates executive performance. Although this discussion and analysisCD&A refers principally to compensation for the Named Executive Officers, the same compensation principles and practices apply to all executives. The compensation of the Chief Executive Officer is subject to the further review and approval of all of the independent Trustees.
obtained from utility and general industry surveys and a specific group of peer utility companies. LevelsIncumbent compensation levels may be lower thanset below the market median for those executives who are new to their roles, while long-tenured, high performing executives may be compensated above median. The review by Pay Governance performed in late 2017December 2020 indicated that the Company'sCompany’s aggregate executive compensation levels werecontinue to be aligned with median market rates.
Pay Governance Independence. In February 2018,2021, the Committee assessed the independence of Pay Governance pursuant to SEC and NYSE rules, and concluded that it is independent and that no conflict of interest exists that would prevent Pay Governance from independently advising the Committee. In making this assessment, the Committee considered the independence factors enumerated in Rule 10C-1(b) under the Securities Exchange Act of 1934, includingas well as the written representations of Pay Governance that Pay Governance does not provide any other services to the Company, the level of fees received from the Company as a percentage of Pay Governance'sGovernance’s total revenues, the policies and procedures employed by Pay Governance to prevent
36 2018 Proxy Statement
|
| | | |||||||||
| Alliant Energy Corporation | | | Dominion Energy, Inc. | | | Pinnacle West Capital Corporation | | | ||
| | | Ameren Corporation | | | DTE Energy Company | | | PPL Corporation | | |
| | ||||||||||
| | American Electric Power Co., Inc. | | Edison International | | Public Service Enterprise Group, Inc. | | | |||
| | | CenterPoint Energy, Inc. | | Entergy Corporation | | | Sempra Energy | | | |
| | | CMS Energy Corp. | | FirstEnergy Corp. | | | WEC Energy Group, Inc. | | | |
| | | Consolidated Edison, Inc. | | NiSource, Inc. | | | Xcel Energy Inc. | |||
| | |
The Committee also determines perquisites to the extent they serve business purposes, and sets supplemental benefits at levels that provide appropriate compensation opportunities to the executives.
heavily weighted toward incentive compensation, and incentive compensation is heavily weighted toward long-term compensation. Since our most senior positions have the greatest responsibility for implementing our long-term business plans and strategies, a greater proportion of total compensation is based on performance with a long-term focus.
2018 Proxy Statement 37
|
| | | | | Percentage of TDC at Target | | | | | | | | |||||||||||||||||||||
| | | | | | | | | | | | | | | | | Long-Term Incentives | | | | | | | | |||||||||
| | Named Executive Officer (NEO) | | | Base Salary | | | Annual Incentive(1) | | | Performance Shares(1) | | | RSUs(2) | | | TDC | | |||||||||||||||
| | James J. Judge | | | | | 14% | | | | | | 18% | | | | | | 34% | | | | | | 34% | | | | | | 100% | | |
| | Philip J. Lembo | | | | | 25% | | | | | | 20% | | | | | | 27.5% | | | | | | 27.5% | | | | | | 100% | | |
| | Werner J. Schweiger | | | | | 25% | | | | | | 20% | | | | | | 27.5% | | | | | | 27.5% | | | | | | 100% | | |
| | Joseph R. Nolan, Jr. | | | | | 25% | | | | | | 20% | | | | | | 27.5% | | | | | | 27.5% | | | | | | 100% | | |
| | Gregory B. Butler | | | | | 28% | | | | | | 20% | | | | | | 26% | | | | | | 26% | | | | | | 100% | | |
| | NEO average, excluding CEO | | | | | 26% | | | | | | 20% | | | | | | 27% | | | | | | 27% | | | | | | 100% | | |
| | Percentage of TDC at Target | | ||||||||||||||
|---|---|---|---|---|---|---|---|---|---|---|---|---|---|---|---|---|
| | | | Long-Term Incentives | | ||||||||||||
| Named Executive Officer (NEO) | Base Salary | Annual Incentive(1) | Performance Shares(1) | RSUs(2) | TDC | |||||||||||
| | | | | | | | | | | | | | | | | |
James J. Judge | | 16 | % | | 18 | % | | 33 | % | | 33 | % | | 100% | ||
Philip J. Lembo | 26 | % | 20 | % | 27 | % | 27 | % | 100% | |||||||
Leon J. Olivier | | 26 | % | | 20 | % | | 27 | % | | 27 | % | | 100% | ||
Werner J. Schweiger | 26 | % | 20 | % | 27 | % | 27 | % | 100% | |||||||
Gregory B. Butler | | 30 | % | | 20 | % | | 25 | % | | 25 | % | | 100% | ||
NEO average, excluding CEO | 27 | % | 20 | % | 27 | % | 27 | % | 100% | |||||||
| | | | | | | | | | | | | | | | | |
| | ![[MISSING IMAGE: tm212409d1-pc_ceobwlr.jpg]](https://capedge.com/proxy/DEF 14A/0001104659-21-042415/tm212409d1-pc_ceobwlr.jpg) | |
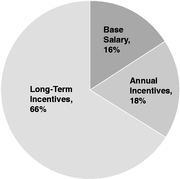 | | 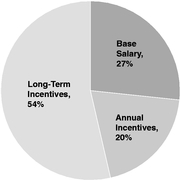 |
![[MISSING IMAGE: tm212409d1-pc_neosbwlr.jpg]](https://capedge.com/proxy/DEF 14A/0001104659-21-042415/tm212409d1-pc_neosbwlr.jpg) | |
business plan. Similarly, the long-term incentive program wasis designed to ensure that the performance metrics wereare properly weighted and supportive of the Company's strategic plan.Company’s strategy. The Committee reviewed the overall compensation program in the context of risks identified in the annual operating and strategic plans, which were both previously subject to Enterprise Risk Management and Risk Committee review.
plan. The annual and long-term incentive programs were designed to include mechanisms to mitigate risk. These mechanisms include realistic goal setting and discretion with respect to actual payments, in addition to:
38 2018 Proxy Statement
Elements of 2020 Compensation |
Base Salary
Due to the hardships experienced by our customers and communities as a result of COVID-19 and the extended outages that took place in 2020 in Connecticut following Storm Isaias, and in spite of excellent performance by our executives in 2020, the Compensation Committee determined that it would freeze base salaries for the senior executive officers, including the Named Executive Officers, at 2020 levels, rather than provide market based base salary increases.
2018 Proxy Statement 39
|
|
ranging from 0%zero percent to 200%200 percent of target. The Committee assigned weightings to each of these specificthe goals. For the financial component, the following goals were used: earnings per share, weighted at 70%,60 percent, dividend growth, goal, weighted at 20%,10 percent, and credit rating,advancement of strategic growth initiatives and regulatory
| | ![[MISSING IMAGE: tm212409d1-pc_financialbwlr.jpg]](https://capedge.com/proxy/DEF 14A/0001104659-21-042415/tm212409d1-pc_financialbwlr.jpg) | |
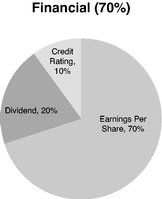 | | 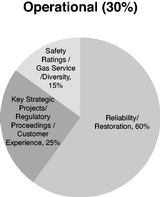 |
![[MISSING IMAGE: tm212409d1-pc_operationbwlr.jpg]](https://capedge.com/proxy/DEF 14A/0001104659-21-042415/tm212409d1-pc_operationbwlr.jpg) | |
performance goals results are as set forth below.did not take into account the additional complexities involved in executing the Operating Plan and accomplishing the goals. The Chief Executive Officer recommended to the Committee payout levelsawards for the executives (other than himself) based on his assessment of each executive'sexecutive’s individual performance towards achievement of the performance goals and the additional accomplishments of the Company, together with each executive'sexecutive’s contributions to the overall performance of the Company. The actual awards determined by the Committee were also based on the same three-component criteria.
40 2018 Proxy Statement
Tablethe calculation of Contents
2018 Proxy Statement 41
|
|
Financial Performance Goals
| | |||||||||||||
| Category | |||||||||||||
|---|---|---|---|---|---|---|---|---|---|---|---|---|---|
| | | | | Company Performance | | | Assessment | | |||||
| | Earnings Per Share | | | $ | | Achieved: Non-GAAP earnings per share, excluding only the Columbia Gas acquisition costs, equaled $3.64 per share, an increase of 5.5% over 2019 and exceeded forecasted industry average | | | 150% | | |||
| | Dividend Growth | | | Increase dividend beyond industry average | | | Achieved: Increased dividend to $2.27 per share, a | ||||||
| | | 160% | | ||||||||||
| Strategic Growth Initiatives | | Advancement of Key Strategic Projects and Regulatory Outcomes | | | Exceeded: | | | 200% | | ||||
| | |||||||||||||
| Weightings = Earnings Per Share – | | ||||||||||||
| | Category | | | 2020 Goal | | | Company Performance | | | Assessment | |
| | Reliability — Average Months Between Interruptions (MBI) | | | Achieve MBI of within 15.5 to 18.5 months | | | Exceeded: MBI = 19.2 months. Above the high level of the performance goal’s range and in the top decile of the industry peer group | | | 175% | |
| | Average Restoration Duration (SAIDI) | | | Achieve SAIDI of 64 to 77 minutes | | | Achieved: SAIDI = 64.0 minutes. At the lowest (best) end of the performance range, and in the top decile of the industry group as measured by recognized industry standards | | | 175% | |
| | Safety Rate (Days Away Restricted Time (DART)) | | | 0.5 – 0.9 DART | | | Achieved: 0.7 DART — Within performance range of the goal and exceeding industry peers, with strong performance in responding to the pandemic | | | 150% | |
| | Gas Service Response | | | 99.2% – 99.6% on time | | | Achieved: 99.6%; Performance equal to industry average | | | 100% | |
| | Diverse Leadership | | | 40% diverse hires or promotions of leadership level | | | Exceeded: 47.6% – Performed well above the goal. We continued support of community efforts that address racial inequality and maintained focus within the Company of our commitment to advance racial equality | | | 200% | |
| | Sustainability Ranking | | | 75th percentile vs. US peer companies | | | Exceeded: At 85th percentile, Eversource outperformed the peer group and is well into the first quartile; numerous recognitions and awards acknowledging the Company’s sustainability excellence again in 2020 | | | 150% | |
| | Transform the Customer Experience | | | Launch new mobile app; increase accuracy of restoration time and customer digital engagement | | | Not Achieved: The “Ways to Save” initiative’s targeted messaging and channels have pivoted to assist customers during the pandemic response with activities such as COVID-19 related product offers, employee high bill training, and virtual energy assessments. The estimated restoration time metric outperformed the goal and finished the year at 93%. Digital Customer Engagement finished above target at 88%, supported by enhancements to the Eversource.com Account Overview page, which has increased our search engine optimization and driven increased web traffic. However, despite these positive advancements, the Compensation Committee determined that because customers and other stakeholders, in Connecticut, felt our storm performance was inadequate, this measure was assessed to have not been achieved | | | 0% | |
| | Category | | | 2020 Goal | | | Company Performance | | | Assessment | |
| | Clean Energy Execution | | | Successfully advance and execute clean energy initiatives | | | Achieved: We have made significant progress on advancing our agreement with the New London State Pier redevelopment, which provides our partnership access to the leading offshore wind port in the Northeast and a strategic advantage that permits greater flexibility in our installation vessel options. Our EV program met year end targets and our energy storage initiative is expected to be in service in mid-2021, within the approved MDPU window. Our energy efficiency programs were impacted by COVID-19, and in response we became the first utility in the nation to conduct virtual home energy audits for our customers | | | 125% | |
| | Weightings = Reliability – 25% Restoration – 25%; Safety, Gas Response, Diversity, Sustainability and Key Initiatives – 50% | | |||||||||
| | Financial Performance at 166% (weighted 70%) | | | | | 116% | | |
| | Operational Performance at 149% (weighted 30%) | | | | | 45% | | |
| | Overall Performance | | | | | 161% | | |
| Category | 2017 Goal | Company Performance | Indicative Assessment | |||||
|---|---|---|---|---|---|---|---|---|
| | | | | | | | | |
| Reliability – Average Months Between Interruptions (MBI) | Achieve MBI of within 15 to 18 months | Exceeded: MBI = 17.6 months. At the top of targeted performance zone, and first quartile vs. industry peers and best ever performance | | 175% | ||||
| Average Restoration Duration (SAIDI) | Achieve SAIDI of 76 to 63 minutes | Achieved: SAIDI = 73.2 minutes. Within targeted performance and first quartile vs. industry peers | 175% | |||||
| Safety Rate | 0.9 - 1.2 days away/restricted | Exceeded: 0.6 DART Best year ever for safety; performance exceeded target range and was first quartile in industry | | 200% | ||||
| Gas Service Response | 99.1% | Exceeded: 99.6%; also achieved all regulatory mandated targets and response was at first quartile vs. industry peers' performance | 125% | |||||
| Diverse Leadership | 37% hires or promotions of leadership level be women or people of color | Exceeded: 37.5%, .5 percentage points above target | | 100% | ||||
| Improve the Customer Experience | Customer billing improvements, enhanced communications, improved digital experience and community support | Partially Achieved: Improvements made as planned in digital offerings and enhanced outage communications. Customer satisfaction scores below expectations | 75% | |||||
| Positive Regulatory Outcomes – Divestiture & State rate activity | Successfully complete the generation assets sale and constructive rate case results | Exceeded: Successfully completed N.H. Generation Divestiture and the MA Rate Case. CT Rate Case was filed and a settlement agreement was reached and filed with PURA for approval | | 200% | ||||
| Positive Outcomes on Key Strategic Initiatives | Major strategic initiatives | Partially Achieved: Aquarion Water Company purchase completed. Bay State Wind making good progress. NPT was selected by Massachusetts in the State's clean energy RFP and progressed through several key siting approvals but was denied approval by New Hampshire Site Evaluation Committee. Access Northeast reconfiguring in light of adverse court decision. | 75% | |||||
| | | | | | | | | |
| Weightings = Reliability and Restoration – 60%; Key Corporate Initiatives – 25%; Safety/Gas Service/Diversity – 15% | ||||||||
| | | | | | | | | |
| ||||
| ||||
| ||||
42 2018 Proxy Statement
|
The following keyimportant financial, strategic, operational, environmental and customer-focused results were also considered significant by the Committee in making an assessment ofassessing overall financial and operational performance, but were not given specific weightings or assigned a specific performance assessment score:
|
The goal of the Committee for 2017 was againCommittee’s philosophy to provide incentives for Company executives to work together as a highly effective, integrated team to achieve or exceed the financial, operational, safety, customer, sustainability, strategic and diversity goals and objectives. The Committee also reviews and assesses individual executive performance. The Committee based the annual incentive payments on team performance and also on the Committee'sCommittee’s assessment of each executive'sexecutive’s individual performance in supporting the performance goals, additional achievements, and overall Company performance. The Committee and all other independent
Trustees assessedresults. With respect to the performance of our Chief Executive Officer, the Committee and basedthe independent Trustees assessed his performance. Based on the recommendations of the Chief Executive Officer as to executives other than himself, the Committee assessed the performance of the Named Executive Officers to determine the individual incentive payments as disclosed in the Summary Compensation Table. Based on the Committee's review, which included its assessment of the performance goals, the significant other accomplishments ofand the Company and the Named Executive Officers, and the overall performance of the Company and each of the Named Executive Officers, consideredto be excellent in its totality by the Committee to have been excellent, the Committeeand approved annual incentive
| | Named Executive Officer | | | 2020 Award | | | 2019 Award | | ||||||
| | James J. Judge | | | | $ | 2,750,000 | | | | | $ | 3,000,000 | | |
| | Philip J. Lembo | | | | | 950,000 | | | | | | 1,000,000 | | |
| | Werner J. Schweiger | | | | | 950,000 | | | | | | 1,050,000 | | |
| | Joseph R. Nolan, Jr. | | | | | 850,000 | | | | | | 774,000 | | |
| | Gregory B. Butler | | | | | 700,000 | | | | | | 740,000 | | |
|
| Named Executive Officer | Award | |||
|---|---|---|---|---|
| | | | | |
James J. Judge | $ | 2,285,000 | ||
Philip J. Lembo | 700,000 | |||
Leon J. Olivier | | 775,000 | ||
Werner J. Schweiger | 775,000 | |||
Gregory B. Butler | | 625,000 | ||
|
|
Our long-term incentive program is intended to focus on the Company'sCompany’s longer-term strategic goals and to help retain our executives. A new three-year program commences every year. For the 2017 - 2019 Long-Term Incentive Program,three programs described below, each executive'sexecutive’s target long-term incentive opportunity consisted of 50% Eversource Energy50 percent Performance Shares and 50%50 percent RSUs. However, for the 2021 – 2023 Program, we have increased the percentage of total long term incentive opportunity that is provided in performance shares to a mix of 75 percent Performance Shares and 25 percent RSUs in response to shareholder comments that we received at shareholder engagement sessions that suggested that the percentage of performance shares should be increased, and to further align our compensation programs with the Committee’s pay for performance philosophy. Performance Shares are designed to reward long-term achievements as measured against pre-established
performance measures. RSUs are designed to
Mr. Judge was elected President and Chief Executive Officer of the Company on April 6, 2016 upon the
2018 Proxy Statement 43
|
retirement of Thomas J. May. Mr. Judge had previously served as Executive Vice President and Chief Financial Officer of the Company until his election as President and Chief Executive Officer. Mr. Lembo was elected Executive Vice President and Chief Financial Officer of the Company on May 4, 2016, having previously served as Vice President and Treasurer. Thus, 2017 was the first year during which the Committee made long term incentive program stock awards to Mr. Judge and Mr. Lembo in their new positions of President and Chief Executive Officer and Executive Vice President and Chief Financial Officer, respectively. The grant date fair values of Mr. Judge's and Mr. Lembo's 2017 stock awards under the 2017 long term incentive program were $5,504,904 and $1,314,086, respectively, compared to their 2016 awards of $1,382,021 and $212,300 respectively.
|
|
Performance Shares are designed to reward future financial performance, measured by long-term earnings growth and shareholder returns over a three-year performance period, therefore aligning managementexecutive compensation with performance. Performance Shares are granted as a target number of Eversource Energy common
|
measures because the Committee continues to believe that they are generally recognized as the best indicators of overall corporate performance. Further, theThe Committee considers it a best practice to use a combination of relative and absolute metrics, with absolute EPS growth serving as a key input to shareholder value and relative TSR serving as the output.
|
For the 2016 - 20182019-2021 Program, the Committee used the same performance measures of EPSG and TSR, and used the same criteria used in the 2017 - 2019 Program described above and the 2015 - 2017 Program described below.
2018-2020 Program.
44 2018 Proxy Statement
| | | Three-Year Average EPS Growth | | |
| | | 9% | | |
| | | 8% | | |
| | | 7% | | |
| | | 6% | | |
| | | 5% | | |
| | | 4% | | |
| | | 3% | | |
| | | 2% | | |
| | | 1% | | |
| | | 0% | | |
| | | Below 0% | | |
| | | | | | | | | | | | | | | | | | | | | | | | | | | | | | | | | | | | | | Three-Year Relative Total Shareholder Return Percentiles | | | ||||||||||||||||||||||||||||||||
| Three-Year | Three-Year Relative Total Shareholder Return Percentiles | |||||||||||||||||||||||||||||||||||||||||||||||||||||||||||||||||||||
| | | | | | | | | | | | | | | | | | | | | | | | | | | | | | | | | | | | | | | | | | Below 10th | | 20th | | 30th | | 40th | | 50th | | 60th | | 70th | | 80th | | 90th | | Above 90th | | | ||||||||||
| Average EPS Growth | Below 10th | 20th | 30th | 40th | 50th | 60th | 70th | 80th | 90th | Above 90th | ||||||||||||||||||||||||||||||||||||||||||||||||||||||||||||
| | | | | | | | | | | | | | | | | | | | | | | | | | | | | | | | | | | | | | | | | | | 110% | | 120% | | 130% | | 140% | | 150% | | 160% | | 170% | | 180% | | 190% | | 200% | | | |||||||||
| | 9% | | 110% | | 120% | | 130% | | 140% | | 150% | | 160% | | 170% | | 180% | | 190% | | 200% | |||||||||||||||||||||||||||||||||||||||||||||||||
| 8% | 100% | 110% | 120% | 130% | 140% | 150% | 160% | 170% | 180% | 190% | ||||||||||||||||||||||||||||||||||||||||||||||||||||||||||||
| | 7% | | 90% | | 100% | | 110% | | 120% | | 130% | | 140% | | 150% | | 160% | | 170% | | 180% | |||||||||||||||||||||||||||||||||||||||||||||||||
| 6% | 80% | 90% | 100% | 110% | 120% | 130% | 140% | 150% | 160% | 170% | ||||||||||||||||||||||||||||||||||||||||||||||||||||||||||||
| | 5% | | 70% | | 80% | | 90% | | 100% | | 110% | | 120% | | 130% | | 140% | | 150% | | 160% | |||||||||||||||||||||||||||||||||||||||||||||||||
| 4% | 60% | 70% | 80% | 90% | 100% | 110% | 120% | 130% | 140% | 150% | ||||||||||||||||||||||||||||||||||||||||||||||||||||||||||||
| | 3% | | 40% | | 50% | | 70% | | 80% | | 90% | | 100% | | 110% | | 120% | | 130% | | 140% | |||||||||||||||||||||||||||||||||||||||||||||||||
| 2% | 20% | 40% | 60% | 70% | 80% | 90% | 100% | 110% | 120% | 130% | ||||||||||||||||||||||||||||||||||||||||||||||||||||||||||||
| | 1% | | — | | 10% | | 40% | | 60% | | 70% | | 80% | | 90% | | 100% | | 110% | | 120% | |||||||||||||||||||||||||||||||||||||||||||||||||
| 0% | — | — | 20% | 30% | 50% | 70% | 80% | 90% | 100% | 110% | ||||||||||||||||||||||||||||||||||||||||||||||||||||||||||||
| | Below 0% | | — | | — | | — | | — | | 10% | | 20% | | 30% | | 40% | | 50% | | 60% | |||||||||||||||||||||||||||||||||||||||||||||||||
| | | | | | | | | | | | | | | | | | | | | | | | | | | | | | | | | | | | | | 100% | | 110% | | 120% | | 130% | | 140% | | 150% | | 160% | | 170% | | 180% | | 190% | | | ||||||||||||||
| | | 90% | | 100% | | 110% | | 120% | | 130% | | 140% | | 150% | | 160% | | 170% | | 180% | | | |||||||||||||||||||||||||||||||||||||||||||||||||
| | | 80% | | 90% | | 100% | | 110% | | 120% | | 130% | | 140% | | 150% | | 160% | | 170% | | | |||||||||||||||||||||||||||||||||||||||||||||||||
| | | 70% | | 80% | | 90% | | 100% | | 110% | | 120% | | 130% | | 140% | | 150% | | 160% | | | |||||||||||||||||||||||||||||||||||||||||||||||||
| | | 60% | | 70% | | 80% | | 90% | | 100% | | 110% | | 120% | | 130% | | 140% | | 150% | | | |||||||||||||||||||||||||||||||||||||||||||||||||
| | | 40% | | 50% | | 70% | | 80% | | 90% | | 100% | | 110% | | 120% | | 130% | | 140% | | | |||||||||||||||||||||||||||||||||||||||||||||||||
| | | 20% | | 40% | | 60% | | 70% | | 80% | | 90% | | 100% | | 110% | | 120% | | 130% | | | |||||||||||||||||||||||||||||||||||||||||||||||||
| | | — | | 10% | | 40% | | 60% | | 70% | | 80% | | 90% | | 100% | | 110% | | 120% | | | |||||||||||||||||||||||||||||||||||||||||||||||||
| | | — | | — | | 20% | | 30% | | 50% | | 70% | | 80% | | 90% | | 100% | | 110% | | | |||||||||||||||||||||||||||||||||||||||||||||||||
| | | — | | — | | — | | — | | 10% | | 20% | | 30% | | 40% | | 50% | | 60% | | | |||||||||||||||||||||||||||||||||||||||||||||||||
| | | Three-Year Average EPS Growth | | |
| | | 9.5% | | |
| | | 8.5% | | |
| | | 7.5% | | |
| | | 6.5% | | |
| | | 5.5% | | |
| | | 4.5% | | |
| | | 3.5% | | |
| | | 2.5% | | |
| | | 1.5% | | |
| | | 0.5% | | |
| | | 0.0% | | |
| | | Below 0% | | |
| | | Three-Year Relative Total Shareholder Return Percentiles | | | |||||||||||||||||||||||||||
| | | Below 10th | | | 20th | | | 30th | | | 40th | | | 50th | | | 60th | | | 70th | | | 80th | | | 90th | | | Above 90th | | |
| | | 110% | | | 120% | | | 130% | | | 140% | | | 150% | | | 160% | | | 170% | | | 180% | | | 190% | | | 200% | | |
| | | 100% | | | 110% | | | 120% | | | 130% | | | 140% | | | 150% | | | 160% | | | 170% | | | 180% | | | 190% | | |
| | | 90% | | | 100% | | | 110% | | | 120% | | | 130% | | | 140% | | | 150% | | | 160% | | | 170% | | | 180% | | |
| | | 80% | | | 90% | | | 100% | | | 110% | | | 120% | | | 130% | | | 140% | | | 150% | | | 160% | | | 170% | | |
| | | 70% | | | 80% | | | 90% | | | 100% | | | 110% | | | 120% | | | 130% | | | 140% | | | 150% | | | 160% | | |
| | | 60% | | | 70% | | | 80% | | | 90% | | | 100% | | | 110% | | | 120% | | | 130% | | | 140% | | | 150% | | |
| | | 40% | | | 50% | | | 70% | | | 80% | | | 90% | | | 100% | | | 110% | | | 120% | | | 130% | | | 140% | | |
| | | 20% | | | 40% | | | 60% | | | 70% | | | 80% | | | 90% | | | 100% | | | 110% | | | 120% | | | 130% | | |
| | | — | | | 10% | | | 40% | | | 60% | | | 70% | | | 80% | | | 90% | | | 100% | | | 110% | | | 120% | | |
| | | — | | | — | | | 20% | | | 30% | | | 50% | | | 70% | | | 80% | | | 90% | | | 100% | | | 110% | | |
| | | — | | | — | | | — | | | 10% | | | 20% | | | 30% | | | 40% | | | 50% | | | 70% | | | 70% | | |
| | | — | | | — | | | — | | | — | | | 10% | | | 20% | | | 30% | | | 40% | | | 50% | | | 60% | | |
| Named Executive Officer | 2016 – 2018 Performance Share Grant | 2017 – 2019 Performance Share Grant | |||||
|---|---|---|---|---|---|---|---|
| | | | | | | | |
James J. Judge | | 12,004 | | 48,259 | |||
Philip J. Lembo | 1,844 | 11,520 | |||||
Leon J. Olivier | | 12,607 | | 12,526 | |||
Werner J. Schweiger | 11,805 | 11,703 | |||||
Gregory B. Butler | | 7,791 | | 9,052 | |||
| Named Executive Officer | | | Performance Share | | |||
| | James J. Judge | | | | | 35,849 | | |
| | Philip J. Lembo | | | | | 8,635 | | |
| | Werner J. Schweiger | | | | | 9,235 | | |
| | Joseph R. Nolan, Jr. | | | | | 7,616 | | |
| | Gregory B. Butler | | | | | 6,575 | | |
the adjusted EPS was calculated in accordance with the plan documents.criteria. The number of Performance Shares awarded to the Named Executive Officers were approved as set forth in the table below.
2015 – 2017 Long-Term Incentive Program Performance Share Award
| | ||||||||||
Performance Share Awards | | |||||||||
| | Named Executive Officer | | | Performance Share Award | | |||||
| | James J. Judge | | | | | 83,274 | | | ||
| Philip J. Lembo | |||||||||
| | | | | 18,186 | | | ||||
| Werner J. | Schweiger | | |||||||
| ||||||||||
| | | 18,464 | | | |||||
| Joseph R. Nolan, Jr. | | | | 13,172 | | | |||
| Gregory B. Butler | | | | 14,318 | | | |||
2018 Proxy Statement 45
|
|
|
Each RSU granted under the long-term incentive program entitles the holder to receive one Company common share at the time of vesting. All RSUs granted under the long-term incentive program vest in equal annual installments over three years. RSU holders are eligible to receive reinvested dividend units on outstanding RSUs held by them to the same extent that dividends are declared and paid on our common shares. Reinvested dividend equivalents are accounted for as additional RSUs that accrue and are distributed with the common shares issued upon vesting
annualized base salary at the time of the grant and measured in dollars.grant. In 2017,2020, the percentage used for each executive officerNamed Executive Officer was based on the executive officer'stheir position in the Company and ranged from 35%90 percent to 213%240 percent of base salary. The Committee reserves the right to increase or decrease the RSU grant from target for each executive officer under special circumstances. The Committee and all other independent members of the
| | | | | RSU Grants | | |||||||||||||||
| | Named Executive Officer | | | 2018 | | | 2019 | | | 2020 | | |||||||||
| | James J. Judge | | | | | 48,912 | | | | | | 46,249 | | | | | | 35,849 | | |
| | Philip J. Lembo | | | | | 10,682 | | | | | | 10,103 | | | | | | 8,635 | | |
| | Werner J. Schweiger | | | | | 10,845 | | | | | | 10,103 | | | | | | 9,235 | | |
| | Joseph R. Nolan, Jr. | | | | | 7,737 | | | | | | 7,623 | | | | | | 7,616 | | |
| | Gregory B. Butler | | | | | 8,410 | | | | | | 8,328 | | | | | | 6,575 | | |
| | RSUs Awarded | |||||||||
|---|---|---|---|---|---|---|---|---|---|---|
| Named Executive Officer | 2015 | 2016 | 2017 | |||||||
| | | | | | | | | | | |
James J. Judge | | 9,800 | | 12,004 | | 48,259 | ||||
Philip J. Lembo | 1,700 | 1,844 | 11,520 | |||||||
Leon J. Olivier | | 10,300 | | 12,607 | | 12,526 | ||||
Werner J. Schweiger | 9,700 | 11,805 | 11,703 | |||||||
Gregory B. Butler | | 6,900 | | 7,791 | | 9,052 | ||||
|
If our earnings were to be restated as a result of noncompliance with accounting rules caused by fraud or misconduct, or if a plan participant engages in a willful material violation of our Code of Business Conduct or material corporate policy, or the breach of a material
agreement, as determined by the Board of Trustees, the participant wouldwill be required by our 2018 Incentive Plan to reimburse us for certain incentive compensation awards received by him or her.
|
shares or other equity securities of the Company or its subsidiaries by our Trustees and executives.executives, including exchange-traded options to purchase or sell securities of the Company (so-called “puts” and “calls”) or financial instruments that are designed to hedge or offset any decrease in the market value of securities of the Company
|
executive vice presidents to own a number of common shares equal
46 2018 Proxy Statement
common shares equal to one to one and one half times base salary.
Officers (and Trustees) may only transact in Eversource Energy common| | ||||||||
| Executive Officer | ||||||||
|---|---|---|---|---|---|---|---|---|
| | | Base Salary Multiple | | |||||
| Chief Executive Officer | | | | | 6 | | |
| Executive Vice Presidents | | | | | 3 | | |
| Operating Company Presidents/Senior Vice Presidents | | | | | 2 | ||
| | |||||||
| | Vice Presidents | | | | | 1-1.5 | | |
Named Executive Officers, have either satisfied the share ownership guidelines or are expected to satisfy them within the applicable timeframe. Common shares, whether held of record, in street name, or in individual 401(k) accounts, and RSUs satisfy the guideline requirements to hold 100% of the net shares. Unexercised stock options and unvestedownership requirements. Unvested performance shares do not count toward satisfying the ownership guidelines. In addition to the share ownership guidelines noted above, all officers must hold all the net shares awarded under the Company'sCompany’s incentive compensation plan until the share ownership guidelines have been met.
As set forth in on pages 43 and 44 of this CD&A, Mr. Judge and Mr. Lembo were elected to the positions of President and Chief Executive Officer and Executive Vice President and Chief Financial Officer respectively in 2016, such that 2017 was the first year that each served in his new position. Each had a resulting substantial increase in the actuarial, formula-based present values of his pension benefit due to the increase in their base pay and annual bonus. This increase is disclosed in the Change in Pension Value and Non-Qualified Deferred Earnings column of the Summary Compensation Table. These accounting-based increases, while representing for Mr. Judge and Mr. Lembo a substantial portion of their 2017 total compensation disclosed in the SEC Total column of the Summary Compensation Table, resulted in no actual 2017 W-2 earnings for either of them.
(Program) differ from those described above. Mr. Olivier's employment agreement provides retirement benefits similar to those of a previous employer instead of the supplementalThe program benefits described above. Under this agreement, he will receive a pension based on a prescribed formula if he meets certain eligibility requirements. The Program benefit payable to Mr. Schweiger is fully vested and is further reduced by benefits he is entitled to receive under previous employers'employers’ retirement plans.
2018 Proxy Statement 47
|
Perquisites
The Company provides executives with limited financial planning benefits, vehicle leasing and access to tickets to sporting
events. The current level of perquisites does not factor into decisions on total compensation.
|
more of the events set forth in the agreements, while still providing an incentive to remain employed with the Company for the transition period that follows.
|
The Company's Incentive Plan permits annual incentive
Company's Company’s best interests to retain discretion to make compensation awards, whether or not deductible.
|
48 2018 Proxy Statement
|
the 20182021 proxy statement and our 20172020 Annual Report on Form 10-K.
Charles K. Gifford, ChairJohn S. ClarkesonSanford Cloud, Jr.James S. DiStasioJohn Y. Kim
20182021 Proxy Statement 4957
|
|
The table below summarizes the total compensation paid or earned by our principal executive officer (Mr. Judge), principal financial officer (Mr. Lembo) and the three other most highly compensated executive officers in 2017,2020, determined in accordance with the applicable SEC disclosure rules (collectively, the Named Executive Officers). As explained in the tables and footnotes below, the amounts reflect the economic benefit to each Named
Executive Officer of the compensation item paid or accrued on their behalf of the Named Executive Officers for the fiscal year ended December 31, 20172020 in accordance with such rules. All salaries, annual incentive amounts and long-term incentive amounts shown for each Named Executive Officer were paid for all services rendered to the Company and its subsidiaries, in all its capacities.
| Name and Principal Position | | | Year | | | Salary | | | Stock Awards(1) | | | Non-Equity Incentive Plan(2) | | | Change in Pension Value and Non-Qualified Deferred Earnings(3) | | | All Other Compensation(4) | | | SEC Total | | | Adjusted SEC Total(5) | | ||||||||||||||||||||||||
James J. Judge Chairman, President and Chief Executive Officer | | | | | 2020 | | | | | $ | 1,371,615 | | | | | $ | 6,682,612 | | | | | $ | 2,750,000 | | | | | $ | 3,742,215 | | | | | $ | 28,834 | | | | | $ | 14,575,276 | | | | | $ | 10,833,061 | | |
| | | | 2019 | | | | | | 1,319,232 | | | | | | 6,676,043 | | | | | | 3,000,000 | | | | | | 8,784,256 | | | | | | 26,557 | | | | | | 19,806,088 | | | | | | 11,021,833 | | | ||
| | | | 2018 | | | | | | 1,277,078 | | | | | | 5,632,217 | | | | | | 2,430,000 | | | | | | 5,560,877 | | | | | | 25,209 | | | | | | 14,925,381 | | | | | | 9,364,504 | | | ||
Philip J. Lembo Executive Vice President and Chief Financial Officer | | | | | 2020 | | | | | | 718,846 | | | | | | 1,609,650 | | | | | | 950,000 | | | | | | 1,248,852 | | | | | | 21,985 | | | | | | 4,549,333 | | | | | | 3,300,481 | | |
| | | | 2019 | | | | | | 680,579 | | | | | | 1,458,368 | | | | | | 1,000,000 | | | | | | 1,318,800 | | | | | | 20,390 | | | | | | 4,478,137 | | | | | | 3,159,337 | | | ||
| | | | 2018 | | | | | | 648,271 | | | | | | 1,230,032 | | | | | | 765,000 | | | | | | 1,535,216 | | | | | | 21,685 | | | | | | 4,200,204 | | | | | | 2,664,988 | | | ||
Werner J. Schweiger Executive Vice President and Chief Operating Officer | | | | | 2020 | | | | | | 765,885 | | | | | | 1,721,496 | | | | | | 950,000 | | | | | | 2,698,083 | | | | | | 20,657 | | | | | | 6,156,121 | | | | | | 3,458,038 | | |
| | | | 2019 | | | | | | 692,694 | | | | | | 1,458,368 | | | | | | 1,050,000 | | | | | | 2,218,536 | | | | | | 21,846 | | | | | | 5,441,444 | | | | | | 3,222,908 | | | ||
| | | | 2018 | | | | | | 658,271 | | | | | | 1,248,802 | | | | | | 815,000 | | | | | | 538,978 | | | | | | 53,896 | | | | | | 3,314,947 | | | | | | 2,775,969 | | | ||
Joseph R. Nolan, Jr. Executive Vice President- Strategy, Customer and Corporate Relations | | | | | 2020 | | | | | | 630,962 | | | | | | 1,419,699 | | | | | | 850,000 | | | | | | 2,134,658 | | | | | | 18,921 | | | | | | 5,054,239 | | | | | | 2,919,581 | | |
| | | | 2019 | | | | | | 589,616 | | | | | | 1,100,380 | | | | | | 774,000 | | | | | | 3,283,296 | | | | | | 20,388 | | | | | | 5,767,680 | | | | | | 2,484,384 | | | ||
| | | | 2018 | | | | | | 561,540 | | | | | | 890,916 | | | | | | 720,000 | | | | | | 1,193,350 | | | | | | 56,084 | | | | | | 3,421,890 | | | | | | 2,228,540 | | | ||
Gregory B. Butler Executive Vice President and General Counsel | | | | | 2020 | | | | | | 670,292 | | | | | | 1,225,646 | | | | | | 700,000 | | | | | | 1,637,907 | | | | | | 15,839 | | | | | | 4,249,684 | | | | | | 2,611,777 | | |
| | | | 2019 | | | | | | 643,270 | | | | | | 1,202,147 | | | | | | 740,000 | | | | | | 2,948,208 | | | | | | 15,518 | | | | | | 5,549,143 | | | | | | 2,600,935 | | | ||
| | | | 2018 | | | | | | 618,271 | | | | | | 968,412 | | | | | | 645,000 | | | | | | 634,394 | | | | | | 15,143 | | | | | | 2,881,220 | | | | | | 2,246,826 | | | ||
| Name and Principal Position | Year | Salary(2) | Stock Awards(3) | Non-Equity Incentive Plan(4) | Change in Pension Value and Non-Qualified Deferred Earnings(5) | All Other Compensation(6) | SEC Total | Adjusted SEC Total(7) | |||||||||||||||||
|---|---|---|---|---|---|---|---|---|---|---|---|---|---|---|---|---|---|---|---|---|---|---|---|---|---|
| | | | | | | | | | | | | | | | | | | | | | | | | | |
James J. Judge | | 2017 | $ | 1,230,694 | $ | 5,504,904 | $ | 2,285,000 | $ | 6,869,854 | $ | 25,009 | $ | 15,915,461 | $ | 9,045,607 | |||||||||
Chairman, President and | 2016 | 959,690 | 1,382,021 | 2,200,000 | 1,616,742 | 24,809 | 6,183,262 | 4,566,520 | |||||||||||||||||
Chief Executive Officer | | 2015 | | 605,650 | | 1,135,526 | | 690,000 | | 895,929 | | 20,672 | | 3,347,777 | | 2,451,848 | |||||||||
| | | | | | | | | | | | | | | | | | | | | | | | | | |
Philip J. Lembo(1) | 2017 | 613,847 | 1,314,086 | 700,000 | 1,246,325 | 21,485 | 3,895,743 | 2,649,418 | |||||||||||||||||
Executive Vice President and | | 2016 | | 439,208 | | 212,300 | | 600,000 | | 543,133 | | 21,285 | | 1,815,926 | | 1,272,793 | |||||||||
Chief Financial Officer | |||||||||||||||||||||||||
| | | | | | | | | | | | | | | | | | | | | | | | | | |
Leon J. Olivier | | 2017 | | 678,270 | | 1,428,841 | | 775,000 | | 397,791 | | 14,464 | | 3,294,366 | | 2,896,575 | |||||||||
Executive Vice President- | 2016 | 654,832 | 1,451,444 | 725,000 | 389,011 | 14,034 | 3,234,320 | 2,845,309 | |||||||||||||||||
Enterprise Energy Strategy | | 2015 | | 635,766 | | 1,193,461 | | 680,000 | | 423,029 | | 13,134 | | 2,945,390 | | 2,522,361 | |||||||||
and Business Development | |||||||||||||||||||||||||
| | | | | | | | | | | | | | | | | | | | | | | | | | |
Werner J. Schweiger | | 2017 | | 634,078 | | 1,334,961 | | 775,000 | | 1,225,581 | | 21,418 | | 3,991,038 | | 2,765,457 | |||||||||
Executive Vice President and | 2016 | 592,108 | 1,359,110 | 700,000 | 1,156,328 | 21,135 | 3,828,681 | 2,672,353 | |||||||||||||||||
Chief Operating Officer | | 2015 | | 600,000 | | 1,123,939 | | 680,000 | | 746,734 | | 21,135 | | 3,171,808 | | 2,425,074 | |||||||||
| | | | | | | | | | | | | | | | | | | | | | | | | | |
Gregory B. Butler(1) | 2017 | 597,886 | 1,032,562 | 625,000 | 1,670,745 | 15,361 | 3,941,554 | 2,270,809 | |||||||||||||||||
Executive Vice President and | | 2016 | | 514,494 | | 896,978 | | 575,000 | | 539,638 | | 12,886 | | 2,538,996 | | 1,999,358 | |||||||||
General Counsel | |||||||||||||||||||||||||
| | | | | | | | | | | | | | | | | | | | | | | | | | |
50 2018 Proxy Statement
Officer. The change in interest rates also impacted the amount of actuarial increase.2020. The Named Executive Officer may not be fully vested in such amounts. More information on this topic is set forth in the Pension Benefits table. There were no above-market earnings in deferred compensation value during 2017,2020, as the terms of the Deferred Compensation Plan provide for market-based investments, including Eversource common shares. Mr. JudgePlease see pages 63 and Mr. Lembo were elected to the positions of President and Chief Executive Officer and Executive Vice President and Chief Financial Officer, respectively, in 2016, such that 2017 was the first year that each served in his new position. Each had a resulting substantial increase in the actuarial, formula-based present value of his pension benefit due to the increase in their base pay and annual bonus. These accounting-based increases, while representing for Mr. Judge and Mr. Lembo a substantial portion of their 2017 total compensation disclosed in the SEC Total above, resulted in no actual 2017 W-2 earnings for either of them.
20182021 Proxy Statement 5159
|
|
underlying equity awards and the grant date for equity-based awards. We have not granted any stock options since 2002.
| | | Estimated Future Payouts Under Non-Equity Incentive Plan Awards | Estimated Future Payouts Under Equity Incentive Plan Awards(1) | | | |||||||||||||||||||||||
|---|---|---|---|---|---|---|---|---|---|---|---|---|---|---|---|---|---|---|---|---|---|---|---|---|---|---|---|---|
| | | All Other Stock Awards: Number of Shares of Stock or Units (#)(2) | Grant Date Fair Value of Stock and Option Awards ($)(3) | |||||||||||||||||||||||||
| Name | Grant Date | Threshold ($) | Target ($) | Maximum ($) | Threshold ($) | Target (#) | Maximum (#) | |||||||||||||||||||||
| | | | | | | | | | | | | | | | | | | | | | | | | | | | | |
James J. Judge | | | | | | | | | | |||||||||||||||||||
Annual Incentive(4) | | 02/03/17 | $ | 714,000 | $ | 1,428,000 | $ | 2,856,000 | $ | — | | — | | — | | — | $ | — | ||||||||||
Long-Term Incentive(5) | | 02/03/17 | | — | | — | | — | | — | | 48,259 | | 96,518 | | 48,259 | | 5,504,904 | ||||||||||
Philip J. Lembo | ||||||||||||||||||||||||||||
Annual Incentive(4) | 02/03/17 | 236,500 | 473,000 | 946,000 | — | — | — | — | — | |||||||||||||||||||
Long-Term Incentive(5) | 02/03/17 | — | — | — | — | 11,520 | 23,040 | 11,520 | 1,314,086 | |||||||||||||||||||
Leon J. Olivier | | | | | | | | | | |||||||||||||||||||
Annual Incentive(4) | | 02/03/17 | | 257,000 | | 514,000 | | 1,028,000 | | — | | — | | — | | — | | — | ||||||||||
Long-Term Incentive(5) | | 02/03/17 | | — | | — | | — | | — | | 12,526 | | 25,052 | | 12,526 | | 1,428,841 | ||||||||||
Werner J. Schweiger | ||||||||||||||||||||||||||||
Annual Incentive(4) | 02/03/17 | 240,000 | 480,000 | 960,000 | — | — | — | — | — | |||||||||||||||||||
Long-Term Incentive(5) | 02/03/17 | — | — | — | — | 11,703 | 23,406 | 11,703 | 1,334,961 | |||||||||||||||||||
Gregory B. Butler | | | | | | | | | | |||||||||||||||||||
Annual Incentive(4) | | 02/03/17 | | 195,000 | | 390,000 | | 780,000 | | — | | — | | — | | — | | — | ||||||||||
Long-Term Incentive(5) | | 02/03/17 | | — | | — | | — | | — | | 9,052 | | 18,104 | | 9,052 | | 1,032,562 | ||||||||||
| | | | | | | | | | | | | | | | | | | | | | | | | | | | | |
| | | | | | | | | | Estimated Future Payouts Under Non-Equity Incentive Plan Awards | | | Estimated Future Payouts Under Equity Incentive Plan Awards(1) | | | All Other Stock Awards: Number of Shares of Stock or Units (#)(2) | | | Grant Date Fair Value of Stock and Option Awards ($)(3) | | ||||||||||||||||||||||||||||||||||||
| Name | | | Grant Date | | | Threshold ($) | | | Target ($) | | | Maximum ($) | | | Threshold ($) | | | Target (#) | | | Maximum (#) | | |||||||||||||||||||||||||||||||||
| James J. Judge | | | | | | | | | | | | | | | | | | | | | | | | | | | | | | | | | | | | | | | | | | | | | | | | | | | | | | | |
| Annual Incentive(4) | | | | | 02/05/20 | | | | | $ | 856,500 | | | | | $ | 1,713,000 | | | | | $ | 3,426,000 | | | | | $ | — | | | | | | — | | | | | | — | | | | | | — | | | | | $ | — | | |
| Long-Term Incentive(5) | | | | | 02/05/20 | | | | | | — | | | | | | — | | | | | | — | | | | | | — | | | | | | 35,849 | | | | | | 71,698 | | | | | | 35,849 | | | | | | 6,682,612 | | |
| Philip J. Lembo | | | | | | | | | | | | | | | | | | | | | | | | | | | | | | | | | | | | | | | | | | | | | | | | | | | | | | | |
| Annual Incentive(4) | | | | | 02/05/20 | | | | | | 288,000 | | | | | | 576,000 | | | | | | 1,152,000 | | | | | | — | | | | | | — | | | | | | — | | | | | | — | | | | | | — | | |
| Long-Term Incentive(5) | | | | | 02/05/20 | | | | | | — | | | | | | — | | | | | | — | | | | | | — | | | | | | 8,635 | | | | | | 17,270 | | | | | | 8,635 | | | | | | 1,609,650 | | |
| Werner J. Schweiger | | | | | | | | | | | | | | | | | | | | | | | | | | | | | | | | | | | | | | | | | | | | | | | | | | | | | | | |
| Annual Incentive(4) | | | | | 02/05/20 | | | | | | 308,000 | | | | | | 616,000 | | | | | | 1,232,000 | | | | | | — | | | | | | — | | | | | | — | | | | | | — | | | | | | — | | |
| Long-Term Incentive(5) | | | | | 02/05/20 | | | | | | — | | | | | | — | | | | | | — | | | | | | — | | | | | | 9,235 | | | | | | 18,470 | | | | | | 9,235 | | | | | | 1,721,496 | | |
| Joseph R. Nolan, Jr. | | | | | | | | | | | | | | | | | | | | | | | | | | | | | | | | | | | | | | | | | | | | | | | | | | | | | | | |
| Annual Incentive(4) | | | | | 02/05/20 | | | | | | 254,000 | | | | | | 508,000 | | | | | | 1,016,000 | | | | | | — | | | | | | — | | | | | | — | | | | | | — | | | | | | — | | |
| Long-Term Incentive(5) | | | | | 02/05/20 | | | | | | — | | | | | | — | | | | | | — | | | | | | — | | | | | | 7,616 | | | | | | 15,232 | | | | | | 7,616 | | | | | | 1,419,699 | | |
| Gregory B. Butler | | | | | | | | | | | | | | | | | | | | | | | | | | | | | | | | | | | | | | | | | | | | | | | | | | | | | | | |
| Annual Incentive(4) | | | | | 02/05/20 | | | | | | 234,500 | | | | | | 469,000 | | | | | | 938,000 | | | | | | — | | | | | | — | | | | | | — | | | | | | — | | | | | | — | | |
| Long-Term Incentive(5) | | | | | 02/05/20 | | | | | | — | | | | | | — | | | | | | — | | | | | | — | | | | | | 6,575 | | | | | | 13,150 | | | | | | 6,575 | | | | | | 1,225,646 | | |
5260 20182021 Proxy Statement
OUTSTANDING EQUITY GRANTS AT DECEMBER 31, 2020 |
|
ended
| | Stock Awards(1) | ||||||||||||
|---|---|---|---|---|---|---|---|---|---|---|---|---|---|
| Name | Number of Shares or Units of Stock That Have Not Vested (#)(2) | Market Value of Shares or Units of Stock That Have Not Vested ($)(3) | Equity Incentive Plan Awards: Number of Unearned Shares, Units or Other Rights That Have Not Vested (#)(4) | Equity Incentive Plan Awards: Market or Payout Value of Unearned Shares, Units or Other Rights That Have Not Vested ($)(5) | |||||||||
| | | | | | | | | | | | | | |
James J. Judge | | 61,901 | | 3,910,906 | | 73,351 | | 4,634,346 | |||||
Philip J. Lembo | 13,818 | 873,019 | 15,719 | 993,112 | |||||||||
Leon J. Olivier | | 25,649 | | 1,620,487 | | 37,680 | | 2,380,605 | |||||
Werner J. Schweiger | 24,010 | 1,516,957 | 35,317 | 2,231,300 | |||||||||
Gregory B. Butler | | 17,399 | | 1,099,253 | | 25,227 | | 1,593,835 | |||||
| | | | | | | | | | | | | | |
| | | | | Stock Awards(1) | | |||||||||||||||||||||
| | Name | | | Number of Shares or Units of Stock That Have Not Vested (#)(2) | | | Market Value of Shares or Units of Stock That Have Not Vested ($)(3) | | | Equity Incentive Plan Awards: Number of Unearned Shares, Units or Other Rights That Have Not Vested (#)(4) | | | Equity Incentive Plan Awards: Market or Payout Value of Unearned Shares, Units or Other Rights That Have Not Vested ($)(5) | | ||||||||||||
| | James J. Judge | | | | | 87,192 | | | | | | 7,542,993 | | | | | | 139,057 | | | | | | 12,029,804 | | |
| | Philip J. Lembo | | | | | 19,873 | | | | | | 1,719,220 | | | | | | 31,200 | | | | | | 2,699,097 | | |
| | Werner J. Schweiger | | | | | 20,549 | | | | | | 1,777,662 | | | | | | 31,994 | | | | | | 2,767,831 | | |
| | Joseph R. Nolan, Jr. | | | | | 16,008 | | | | | | 1,384,824 | | | | | | 24,320 | | | | | | 2,103,917 | | |
| | Gregory B. Butler | | | | | 15,680 | | | | | | 1,356,448 | | | | | | 24,729 | | | | | | 2,139,304 | | |
20182021 Proxy Statement 5361
|
|
RSU and performance share grants to the
| | Option Awards | Stock Awards | |||||||||||
|---|---|---|---|---|---|---|---|---|---|---|---|---|---|
| Name | Number of Shares Acquired on Exercise (#) | Value Realized on Exercise(1) | Number of Shares Acquired on Vesting (#)(2) | Value Realized on Vesting(3) | |||||||||
| | | | | | | | | | | | | | |
James J. Judge | | — | $ | — | | 24,892 | $ | 1,395,241 | |||||
Philip J. Lembo | — | — | 4,164 | 233,432 | |||||||||
Leon J. Olivier | | | | | | 26,112 | | 1,463,651 | |||||
Werner J. Schweiger | 124,640 | 4,380,089 | 19,631 | 1,100,165 | |||||||||
Gregory B. Butler | | — | | — | | 17,116 | | 959,431 | |||||
| | | | | | | | | | | | | | |
| | | | | Stock Awards | | |||||||||
| | Name | | | Number of Shares Acquired on Vesting (#)(1) | | | Value Realized on Vesting(2) | | ||||||
| | James J. Judge | | | | | 130,082 | | | | | $ | 12,341,297 | | |
| | Philip J. Lembo | | | | | 30,379 | | | | | | 2,882,970 | | |
| | Werner J. Schweiger | | | | | 30,804 | | | | | | 2,923,374 | | |
| | Joseph R. Nolan, Jr. | | | | | 21,257 | | | | | | 2,016,830 | | |
| | Gregory B. Butler | | | | | 24,010 | | | | | | 2,278,378 | | |
| | Name | | | 2017 Program | | | 2018 Program | | | 2019 Program | | |||||||||
| | James J. Judge | | | | | 96,929 | | | | | | 17,314 | | | | | | 15,839 | | |
| | Philip J. Lembo | | | | | 23,138 | | | | | | 3,782 | | | | | | 3,459 | | |
| | Werner J. Schweiger | | | | | 23,506 | | | | | | 3,839 | | | | | | 3,459 | | |
| | Joseph R. Nolan, Jr. | | | | | 15,907 | | | | | | 2,739 | | | | | | 2,611 | | |
| | Gregory B. Butler | | | | | 18,181 | | | | | | 2,977 | | | | | | 2,852 | | |
| Name | 2014 Program | 2015 Program | 2016 Program | 2017 Program | |||||||||
|---|---|---|---|---|---|---|---|---|---|---|---|---|---|
| | | | | | | | | | | | | | |
James J. Judge | | 17,278 | | 3,486 | | 4,128 | | — | |||||
Philip J. Lembo | 2,926 | 605 | 633 | — | |||||||||
Leon J. Olivier | | 18,114 | | 3,663 | | 4,335 | | — | |||||
Werner J. Schweiger | 12,122 | 3,450 | 4,060 | — | |||||||||
Gregory B. Butler | | 11,983 | | 2,454 | | 2,679 | | — | |||||
| | | | | | | | | | | | | | |
In all cases, we reduce the distribution of common shares by that number of shares valued in an amount sufficient to satisfy payroll tax withholding obligations.
|
program benefit as a life annuity with a one-third spousal contingent annuitant option (the typical payment form under that Plan). For Mr. Butler, we assumed a payment of benefits in the form of a contingent annuitant option. Such earned pension program benefit value could otherwise
54 2018 Proxy Statement
December 31, 2017.2020. For Messrs. Judge, Lembo, Schweiger and Schweiger,Nolan, the values shown reflect actual 20172020 salary and annual incentives earned in 20162019 but paid in 20172020 (per applicable supplemental program rules). For Mr. Butler, the values shown reflect actual 20172020 salary and annual incentives earned in 20162020 but paid in 20172021 (per applicable supplemental program rules). Mr. Olivier's benefit was calculated as is set forth in the footnote (1) below.
pre-retirement mortality, turnover or disability. However, for the postretirement period beginning at retirement age, we used the 20172020 IRS lump sum mortality table for Mr.Messrs. Judge, Mr.
|
| Name | | | Plan Name | | | Number of Years Credited Service (#) | | | Present Value of Accumulated Benefits | | | During Last Fiscal Year | | |||||||||
| James J. Judge | | | Retirement Plan (QP) | | | | | 43.33 | | | | | $ | 2,965,694 | | | | | $ | — | | |
| | | | Supplemental Plan (PEP) | | | | | 43.33 | | | | | | 17,973,382 | | | | | | — | | |
| | | | Supplemental Plan (SERP) | | | | | 20.00 | | | | | | 16,191,135 | | | | | | — | | |
| Philip J. Lembo | | | Retirement Plan (QP) | | | | | 37.17 | | | | | | 1,402,800 | | | | | | — | | |
| | | | Supplemental Plan (PEP) | | | | | 37.17 | | | | | | 6,162,300 | | | | | | — | | |
| | | | Supplemental Plan (SERP) | | | | | 11.00 | | | | | | 228,554 | | | | | | — | | |
| Werner J. Schweiger | | | Retirement Plan (QP) | | | | | 18.83 | | | | | | 651,924 | | | | | | — | | |
| | | | Supplemental Plan (Excess) | | | | | 18.83 | | | | | | 3,046,192 | | | | | | — | | |
| | | | Supplemental Plan (SERP) | | | | | 18.00 | | | | | | 10,243,128 | | | | | | — | | |
| Joseph R. Nolan, Jr. | | | Retirement Plan (QP) | | | | | 35.42 | | | | | | 1,084,126 | | | | | | — | | |
| | | | Supplemental Plan (Excess) | | | | | 35.42 | | | | | | 4,051,276 | | | | | | — | | |
| | | | Supplemental Plan (SERP) | | | | | 20.00 | | | | | | 6,968,644 | | | | | | — | | |
| Gregory B. Butler | | | Retirement Plan (QP) | | | | | 24.00 | | | | | | 1,588,870 | | | | | | — | | |
| | | | Supplemental Plan (Excess) | | | | | 24.00 | | | | | | 6,662,938 | | | | | | — | | |
| | | | Supplemental Plan (Excess) | | | | | 24.00 | | | | | | 5,045,047 | | | | | | — | | |
| Name | Plan Name | Number of Years Credited Service (#) | Present Value of Accumulated Benefits | During Last Fiscal Year | ||||||||
|---|---|---|---|---|---|---|---|---|---|---|---|---|
| | | | | | | | | | | | | |
James J. Judge | Retirement Plan | | 40.33 | $ | 2,718,021 | $ | — | |||||
| Supplemental Plan | | 20.00 | | 8,420,744 | | — | |||||
| Supplemental Plan | | 40.33 | | 7,904,098 | | — | |||||
Philip J. Lembo | Retirement Plan | 8.75 | 1,201,331 | — | ||||||||
| Supplemental Plan | 8.75 | 2,489,455 | — | |||||||||
Leon J. Olivier (1) | Retirement Plan | | 18.83 | | 838,851 | | — | |||||
| Supplemental Plan | | 16.33 | | 6,436,118 | | — | |||||
| Supplemental Plan | | 31.27 | | 1,207,823 | | 105,966 | |||||
Werner J. Schweiger | Retirement Plan | 15.83 | 500,881 | — | ||||||||
| Supplemental Plan | 15.83 | 1,902,091 | — | |||||||||
| Supplemental Plan | 15.00 | 6,082,675 | — | |||||||||
Gregory B. Butler | Retirement Plan | | 21.00 | | 1,115,793 | | — | |||||
| Supplemental Plan | | 21.00 | | 3,972,477 | | | |||||
| Target | | 21.00 | | 2,988,076 | | — | |||||
| | | | | | | | | | | | | |
2018 Proxy Statement 55
|
|
along with aggregate balances on contributions. See the narrative above in the CD&A under the caption "Elements of 2017 Compensation — Other —“Other Benefits – Deferred
Compensation" Compensation” for more detail on our non-qualified deferred compensation program.
| Name | Executive Contributions in Last FY(1) | Registrant Contributions in Last FY | Aggregate Earnings in in Last FY | Aggregate Withdrawals/ Distributions | Aggregate Balance at Last FYE(2) | |||||||||||
|---|---|---|---|---|---|---|---|---|---|---|---|---|---|---|---|---|
| | | | | | | | | | | | | | | | | |
James J. Judge | $ | — | $ | — | $ | 868,753 | $ | — | $ | 5,693,348 | ||||||
Philip J. Lembo | — | — | 195,092 | — | 1,370,466 | |||||||||||
Leon J. Olivier | | 570,654 | | — | | 1,073,542 | | — | | 4,884,489 | ||||||
Werner J. Schweiger | — | — | 2,344,596 | — | 17,228,164 | |||||||||||
Gregory B. Butler | | — | | — | | 3,038 | | — | | 20,607 | ||||||
| | | | | | | | | | | | | | | | | |
| | Name | | | Executive Contributions in Last FY(1) | | | Registrant Contributions in Last FY | | | Aggregate Earnings in in Last FY | | | Aggregate Withdrawals/ Distributions | | | Aggregate Balance at Last FYE(2) | | |||||||||||||||
| | James J. Judge | | | | $ | — | | | | | $ | — | | | | | $ | 385,688 | | | | | $ | — | | | | | $ | 8,496,104 | | |
| | Philip J. Lembo | | | | | — | | | | | | — | | | | | | 228,733 | | | | | | — | | | | | | 1,844,255 | | |
| | Werner J. Schweiger | | | | | — | | | | | | — | | | | | | 3,299,340 | | | | | | | | | | | | 23,106,189 | | |
| | Joseph R. Nolan, Jr. | | | | | — | | | | | | — | | | | | | 525,639 | | | | | | — | | | | | | 7,219,258 | | |
| | Gregory B. Butler | | | | | — | | | | | | — | | | | | | 1,898 | | | | | | — | | | | | | 29,401 | | |
|
assets of the Company other than, for Mr. Butler, to an entity with respect to which following completion of the transaction more than 50% (75% for Mr. Olivier)50 percent of common shares or other voting securities is then owned by all or substantially all of the persons who were the beneficial owners of common shares and other voting securities immediately prior to such transaction.
56 2018 Proxy Statement
than 50 miles from the executive'sexecutive’s pre-change in control principal business location (or for Messrs. Judge, Lembo, Schweiger and Schweiger,Nolan, an involuntary transfer outside the Greatergreater Boston Metropolitan Area)metropolitan area), or requiring business travel to a substantially greater extent than required prior to the change in control.
Payments Upon Termination |
2018 Proxy Statement 57
|
|
| | Type of Payments | Voluntary Termination | Involuntary Termination Not for Cause | Termination Upon Death or Disability | Termination Following a Change in Control | ||||||||||
|---|---|---|---|---|---|---|---|---|---|---|---|---|---|---|---|
| | | | | | | | | | | | | | | | |
James J. Judge | Annual Incentives(1) | $ | — | $ | — | $ | — | $ | 1,428,000 | ||||||
| Performance Shares(2) | | 2,260,474 | | 2,260,474 | | 2,260,474 | | 4,634,346 | ||||||
| RSUs(3) | | 1,421,180 | | 1,421,180 | | 1,421,180 | | 3,910,906 | ||||||
| Special Retirement Benefit(4) | | — | | — | | — | | 12,618,115 | ||||||
| Health and Welfare Benefits(5) | | — | | — | | — | | 92,049 | ||||||
| Perquisites(6) | | — | | — | | — | | 15,000 | ||||||
| Excise Tax and Gross-ups(7) | | — | | — | | — | | 9,235,719 | ||||||
| Separation Payment for Liquidated Damages(8) | | — | | — | | — | | 10,326,000 | ||||||
| | | | | | | | | | | | | | | | |
| Total | $ | 3,681,655 | $ | 3,681,655 | $ | 3,681,655 | $ | 42,260,135 | ||||||
| | | | | | | | | | | | | | | | |
Philip J. Lembo | Annual Incentives(1) | $ | — | $ | — | $ | — | $ | 473,000 | ||||||
| Performance Shares(2) | 449,108 | 449,108 | 449,108 | 993,112 | |||||||||||
| RSUs(3) | 304,596 | 304,596 | 304,596 | 873,019 | |||||||||||
| Special Retirement Benefit(4) | — | — | — | 2,615,100 | |||||||||||
| Health and Welfare Benefits(5) | — | — | — | 40,296 | |||||||||||
| Perquisites(6) | — | — | — | 10,000 | |||||||||||
| Separation Payment for Liquidated Damages(8) | — | — | — | 2,460,000 | |||||||||||
| | | | | | | | | | | | | | | | |
| Total | $ | 753,704 | $ | 753,704 | $ | 753,704 | $ | 7,464,527 | |||||||
| | | | | | | | | | | | | | | | |
Leon J. Olivier | Annual Incentives(1) | $ | — | $ | — | $ | — | $ | 514,000 | ||||||
| Performance Shares(2) | | 2,380,605 | | 2,380,605 | | 2,380,605 | | 2,380,605 | ||||||
| RSUs(3) | | 1,620,487 | | 1,620,487 | | 1,620,487 | | 1,620,487 | ||||||
| Health and Welfare Benefits(5) | | — | | — | | — | | 37,520 | ||||||
| Perquisites(6) | | — | | — | | — | | — | ||||||
| Separation Payment for Liquidated Damages(8) | | — | | — | | — | | 1,198,750 | ||||||
| Separation Payment for Non-Compete Agreement(9) | | — | | — | | — | | 1,198,750 | ||||||
| | | | | | | | | | | | | | | | |
| Total | $ | 4,001,092 | $ | 4,001,092 | $ | 4,001,092 | $ | 6,950,112 | ||||||
| | | | | | | | | | | | | | | | |
Werner J. Schweiger | Annual Incentives(1) | $ | — | $ | — | $ | — | $ | 480,000 | ||||||
| Performance Shares(2) | 1,458,259 | 1,458,259 | 1,458,259 | 2,231,300 | |||||||||||
| RSUs(3) | 684,308 | 684,308 | 684,308 | 1,516,957 | |||||||||||
| Special Retirement Benefit(4) | — | — | — | 2,180,720 | |||||||||||
| Health and Welfare Benefits(5) | — | — | — | 82,475 | |||||||||||
| Perquisites(6) | — | — | — | 15,000 | |||||||||||
| Separation Payment for Liquidated Damages(8) | — | — | — | 4,020,000 | |||||||||||
| | | | | | | | | | | | | | | | |
| Total | $ | 2,142,567 | $ | 2,142,567 | $ | 2,142,567 | $ | 10,526,451 | |||||||
| | | | | | | | | | | | | | | | |
Gregory B. Butler | Annual Incentives(1) | $ | — | $ | — | $ | — | $ | 390,000 | ||||||
| Performance Shares(2) | | 1,025,640 | | 1,025,640 | | 1,025,640 | | 1,593,835 | ||||||
| RSUs(3) | | 488,756 | | 488,756 | | 488,756 | | 1,099,253 | ||||||
| Special Retirement Benefit(4) | | — | | 4,803,710 | | — | | 5,236,764 | ||||||
| Health and Welfare Benefits(5) | | — | | 22,399 | | — | | 33,599 | ||||||
| Perquisites(6) | | — | | 10,000 | | — | | 15,000 | ||||||
| Excise Tax and Gross-Ups(7) | | — | | — | | — | | 2,188,796 | ||||||
| Separation Payment for Liquidated Damages(8) | | — | | 990,000 | | — | | 1,980,000 | ||||||
| Separation Payment for Non-Compete Agreement(9) | | — | | 990,000 | | — | | 990,000 | ||||||
| | | | | | | | | | | | | | | | |
| Total | $ | 1,514,396 | $ | 8,330,505 | $ | 1,514,396 | $ | 13,527,247 | ||||||
| | | | | | | | | | | | | | | | |
| | | | Type of Payments | | | Voluntary Termination | | | Involuntary Termination Not for Cause | | | Termination Upon Death or Disability | | | Termination Following a Change in Control | | ||||||||||||
| James J. Judge | | | Annual Incentives(1) | | | | $ | ― | | | | | $ | ― | | | | | $ | ― | | | | | $ | 1,713,000 | | |
| | Performance Shares(2) | | | | | 8,500,235 | | | | | | 8,500,235 | | | | | | 8,500,235 | | | | | | 12,029,804 | | | ||
| | RSUs(3) | | | | | 3,689,057 | | | | | | 3,689,057 | | | | | | 3,689,057 | | | | | | 7,542,993 | | | ||
| | Special Retirement Benefit(4) | | | | | ― | | | | | | ― | | | | | | ― | | | | | | 2,832,835 | | | ||
| | Health and Welfare Benefits(5) | | | | | ― | | | | | | ― | | | | | | ― | | | | | | 107,472 | | | ||
| | Perquisites(6) | | | | | ― | | | | | | ― | | | | | | ― | | | | | | 15,000 | | | ||
| | Excise Tax and Gross-ups(7) | | | | | ― | | | | | | ― | | | | | | ― | | | | | | 5,793,493 | | | ||
| | Separation Payment for Liquidated Damages(8) | | | | | ― | | | | | | ― | | | | | | ― | | | | | | 13,110,000 | | | ||
| | Total | | | | $ | 12,189,292 | | | | | $ | 12,189,292 | | | | | $ | 12,189,292 | | | | | $ | 43,144,597 | | | ||
| Philip J. Lembo | | | Annual Incentives(1) | | | | $ | ― | | | | | $ | ― | | | | | $ | ― | | | | | $ | 576,000 | | |
| | Performance Shares(2) | | | | | 1,880,186 | | | | | | 1,880,186 | | | | | | 1,880,186 | | | | | | 2,699,097 | | | ||
| | RSUs(3) | | | | | 827,752 | | | | | | 827,752 | | | | | | 827,752 | | | | | | 1,719,220 | | | ||
| | Special Retirement Benefit(4) | | | | | ― | | | | | | ― | | | | | | ― | | | | | | 2,512,913 | | | ||
| | Health and Welfare Benefits(5) | | | | | ― | | | | | | ― | | | | | | ― | | | | | | 47,192 | | | ||
| | Perquisites(6) | | | | | ― | | | | | | ― | | | | | | ― | | | | | | 10,000 | | | ||
| | Separation Payment for Liquidated Damages(8) | | | | | ― | | | | | | ― | | | | | | ― | | | | | | 3,440,000 | | | ||
| | Total | | | | $ | 2,707,939 | | | | | $ | 2,207,939 | | | | | $ | 2,707,939 | | | | | $ | 11,004,422 | | | ||
| Werner J. Schweiger | | | Annual Incentives(1) | | | | $ | ― | | | | | $ | ― | | | | | $ | ― | | | | | $ | 616,000 | | |
| | Performance Shares(2) | | | | | 1,913,179 | | | | | | 1,913,179 | | | | | | 1,913,179 | | | | | | 2,767,831 | | | ||
| | RSUs(3) | | | | | 848,802 | | | | | | 848,802 | | | | | | 848,802 | | | | | | 1,777,662 | | | ||
| | Special Retirement Benefit(4) | | | | | ― | | | | | | ― | | | | | | ― | | | | | | 3,622,473 | | | ||
| | Health and Welfare Benefits(5) | | | | | ― | | | | | | ― | | | | | | ― | | | | | | 96,858 | | | ||
| | Perquisites(6) | | | | | | | | | | | | | | | | | ― | | | | | | 15,000 | | | ||
| | Excise Tax and Gross-ups(7) | | | | | | | | | | | | | | | | | | | | | | | 144,237 | | | ||
| | Separation Payments for Liquidated Damages(8) | | | | | | | | | | | | | | | | | | | | | | | 5,460,000 | | | ||
| | Total | | | | $ | 2,761,981 | | | | | $ | 2,761,981 | | | | | $ | 2,761,981 | | | | | $ | 14,500,061 | | | ||
| Joseph R. Nolan, Jr. | | | Annual Incentives(1) | | | | $ | ― | | | | | $ | ― | | | | | $ | ― | | | | | $ | 508,000 | | |
| | Performance Shares(2) | | | | | 1,420,462 | | | | | | 1,420,462 | | | | | | 1,420,462 | | | | | | 2,103,917 | | | ||
| | RSUs(3) | | | | | 645,146 | | | | | | 645,146 | | | | | | 645,146 | | | | | | 1,384,824 | | | ||
| | Special Retirement Benefit(4) | | | | | ― | | | | | | ― | | | | | | ― | | | | | | 4,057,187 | | | ||
| | Health and Welfare Benefits(5) | | | | | ― | | | | | | ― | | | | | | ― | | | | | | 94,572 | | | ||
| | Perquisites(6) | | | | | ― | | | | | | ― | | | | | | ― | | | | | | 15,000 | | | ||
| | Excise Tax and Gross-ups(7) | | | | | ― | | | | | | ― | | | | | | ― | | | | | | 2,112,808 | | | ||
| | Separation Payment for Liquidated Damages(8) | | | | | ― | | | | | | ― | | | | | | ― | | | | | | 4,227,000 | | | ||
| | Total | | | | $ | 2,065,609 | | | | | $ | 2,065,609 | | | | | $ | 2,065,609 | | | | | $ | 14,503,308 | | | ||
| | | | Type of Payments | | | Voluntary Termination | | | Involuntary Termination Not for Cause | | | Termination Upon Death or Disability | | | Termination Following a Change in Control | | ||||||||||||
| Gregory B. Butler | | | Annual Incentives(1) | | | | $ | ― | | | | | $ | ― | | | | | $ | ― | | | | | $ | 469,000 | | |
| | Performance Shares(2) | | | | | 1,496,608 | | | | | | 1,496,608 | | | | | | 1,496,608 | | | | | | 2,139,304 | | | ||
| | RSUs(3) | | | | | 656,057 | | | | | | 656,057 | | | | | | 656,057 | | | | | | 1,356,448 | | | ||
| | Special Retirement Benefit(4) | | | | | ― | | | | | | 5,999,084 | | | | | | ― | | | | | | 5,999,083 | | | ||
| | Health and Welfare Benefits(5) | | | | | ― | | | | | | 25,488 | | | | | | ― | | | | | | 38,232 | | | ||
| | Perquisites(6) | | | | | ― | | | | | | 10,000 | | | | | | ― | | | | | | 15,000 | | | ||
| | Excise Tax and Gross-Ups(7) | | | | | ― | | | | | | 1,724,948 | | | | | | ― | | | | | | 2,231,170 | | | ||
| | Separation Payment for Liquidated Damages(8) | | | | | ― | | | | | | 1,073,000 | | | | | | ― | | | | | | 1,073,000 | | | ||
| | Separation Payment for Non-Compete Agreement(9) | | | | | ― | | | | | | 1,073,000 | | | | | | ― | | | | | | 2,146,000 | | | ||
| | Total | | | | $ | 2,152,664 | | | | | $ | 11,658,184 | | | | | $ | 2,152,664 | | | | | $ | 15,067,237 | | | ||
58 2018 Proxy Statement
and the 2017 - 2019 Long-Term Incentive Plan. For Messrs. Judge, Lembo, Schweiger and Butler, representsRepresents 100 percent of the performance share awards under the 2015 - 20172018 – 2020 Long-Term Incentive Program, 67 percent of the performance share awards under the 2016 - 20182019 – 2021 Long-Term Incentive Program and 33 percent of the performance share awards under the 2017 - 20192020 – 2022 Long-Term Incentive Program. For all, theThe values were calculated by multiplying the number of RSUs by $63.18,$86.51, the closing price of our common shares on December 29, 2017,31, 2020, the last trading day of the year. For Termination Following a Change in Control: Represents 100 percent of the performance share awards under each of the three Programs noted in the previous two sentences.
|
|
Our CEOChief Executive Officer to median employee pay ratio is calculated pursuant to the requirements of Item 402(u) of Regulation S-K. We identify a new median employee each year. For 2020, we identified the median employee by reviewing the 20172020 total cash compensation of all full-time employees, excluding our CEO,Chief Executive Officer, who were employed by the Company and its subsidiaries on December 31, 2017.2020. In our assessment of median employee compensation, we annualized pay for those employees who commenced work during 2017.2020. Otherwise, we did not make any assumptions, adjustments, or estimates with respect to total cash compensation, and we did not annualize the compensation for any full-time employees who were not employed by the Company at the end of 2017.2020. We believe the use of total cash compensation for all
employees is a
6068 20182021 Proxy Statement
|
We achieved very positiveour excellent financial, operational and strategic results in 2017, and as a result,2020, the Compensation Committee provided base pay increasesincentive grants and incentive awards to the executive officers, including the Named Executive Officers, reflecting our performance.
In addition, the Compensation Committee determined that despite that strong performance it would freeze base salaries of senior executives, including the Named Executive Officers, at 2020 levels in recognition of the hardships experienced by our customers and communities resulting from COVID-19 and the effects of Storm Isaias.
2018 Proxy Statement 61
|
may vote either "FOR"“FOR” or "AGAINST"“AGAINST” the item or you may abstain from voting. Abstentions and broker non-votes will have no effect on the outcome of the vote, as they do not count as votes cast.
philosophy and in achieving its goals. We are requesting your non-binding vote on the following resolution:
"
”
| | | The Board of Trustees recommends that Shareholders vote FOR this Item.
70 2021 Proxy Statement Item 3: Ratification of the
The Audit Committee selected the independent registered public accounting firm of Deloitte & Touche LLP to serve as the independent registered public accounting firm of Eversource Energy and its subsidiaries for fiscal year The Audit Committee is periodically considers whether there should be a regular rotation of the firm. the firm’s extensive experience and expertise regarding the Company and the utility industry, its performance, the competitive fee structure of the relationship, and the avoidance of the substantial commitment of management and Committee resources that would be involved in onboarding a new Representatives of Deloitte & Touche LLP are expected to be present at the Annual Meeting. They will have the opportunity to make a statement, if they desire to do so, and to respond to appropriate questions raised by shareholders at the meeting. The affirmative vote of a majority of
Relationship With Principal Independent Registered Public Accounting Firm
Fees Billed by Principal Independent Registered Public Accounting Firm.
The aggregate fees billed to the Company and its subsidiaries by Deloitte & Touche LLP, the member firms of Deloitte Touche Tohmatsu, and their respective affiliates (collectively, the Deloitte Entities), for the years ended December 31,
(1) Audit fees in 2020 and 2019 consisted of
2019.
(3) There were no tax fees rendered and no tax fees billed (4) All Other Fees for the period December 31, 2020 and The Audit Committee pre-approves all auditing services and permitted audit related or other services (including the fees and terms thereof) to be performed for us by our independent registered public accounting firm, subject to the de minimis exceptions for non-audit services described in Section 10A(i)(1)(B) of the Securities Exchange Act of 1934, which are approved by the Audit Committee prior to the completion of the audit. The Audit Committee may form and delegate its authority to subcommittees consisting of one or more members when appropriate, including the authority to grant pre-approvals of audit and permitted non-audit services, provided that decisions of such The Audit Committee has considered whether the provision by the Deloitte Entities of the non-audit services described above was allowed under Rule 2-01(c)(4) of Regulation S-X and was compatible with maintaining the independence of the registered public accountants and has concluded that the Deloitte Entities were and are independent of us in all respects.
Report of the Audit Committee The Audit Committee of the Board of Trustees is comprised of the In November 2020, the Committee approved an amendment to its charter, as recommended by The Institute of Internal Auditors, adding additional oversight duties relating to reviews of internal consistent with the responsibilities of the Audit Committee as outlined in its charter. As noted, the Audit Committee is solely responsible for oversight of the relationship of the Company with our independent registered public accounting firm on behalf of the Board of Trustees. As part of these responsibilities, during • Received the written disclosures and the letter from Deloitte & Touche LLP as required by applicable requirements of the Public Company Accounting Oversight Board (PCAOB) regarding Deloitte & • Discussed with Deloitte & Touche LLP the matters required to be discussed by Auditing Standard No. 16, Communications with Audit Committees, as adopted by the PCAOB; and • Reviewed and discussed with management the audited consolidated financial statements of Eversource Energy for the years ended December 31,
Management is responsible for the 72 2021 Proxy Statement Item 3: Ratification of the Selection of the Independent Registered Public Accounting Firm with generally accepted accounting principles in the United States and expressing an opinion on the effectiveness of our internal control over financial reporting as of the end of the fiscal year. In performing their oversight responsibility, the Audit Committee, whose members are all financially literate and whose Chair is an audit committee financial expert as defined by SEC rules, rely without independent verification on the information provided to them, and on the representations made by management and Deloitte & Touche LLP. Based upon the review and discussions described in this report, the Audit Committee recommended to the Board of Trustees that the audited consolidated financial statements be included in Eversource Report on Form 10-K for the year ended December 31, The Audit Committee has directed the preparation of this report and has approved its content and submission to the shareholders. Respectfully submitted, Francis A. Doyle (Chair) John Y. Kim Kenneth R. Leibler Frederica M. Williams February
The Board of Trustees knows of no matters other than those presented in this proxy statement to come before the meeting. However, if any other matters properly come before the meeting, the persons named in the enclosed proxy will vote in their discretion with respect to such other matters.
If you would like us to consider including a proposal in our proxy statement for the the authority to vote against, or take other appropriate action with respect to any proposal that does not comply with these or other applicable requirements. Proposals should be addressed to: Richard J. Morrison Secretary Eversource Energy 800 Boylston Street, 17th Floor Boston, Massachusetts 02199-7050
The
Questions and Answers About the Annual Meeting and Voting
WHAT AM I VOTING ON? A: The Board of Trustees of Eversource Energy is asking you to vote on
2021 Proxy Statement 75 • You may vote by mail. If you received a paper proxy card, you can vote by mail by completing, signing and dating the proxy card and returning it in the pre-addressed, postage-prepaid envelope accompanying the proxy card. Proxy cards submitted by mail must be received by the time of the Annual Meeting in order for your shares to be voted.
meeting center site. If you hold common shares through a brokerage firm, bank, other financial intermediary or nominee (known as shares held in Q: HOW DO I ATTEND THE ONLINE MEETING? A: Attending the Virtual Meeting as a Shareholder of Record Shareholders of record as of March 10, 2021 (i.e., those who held shares in their own names as reflected in the records of our transfer agent, Computershare) may attend the Annual Meeting by accessing http://www.meetingcenter.io/258120406 and entering the 15-digit control number on the Proxy Card or Notice of Availability of Proxy Materials they previously received, and the Annual Meeting password ES2021. Registering to Attend the Annual Meeting as a Beneficial Owner Beneficial owners of record as of March 10, 2021 (those who held shares in an account at a bank, broker or other nominee) will need to obtain proof of your proxy power (a legal proxy) from their bank, broker or other nominee that hold your shares. Once beneficial owners have received a legal proxy from their bank, broker or other nominee, they should email that legal proxy to our transfer agent, Computershare, at legalproxy@computershare.com and should label it “Legal Proxy” in the subject line. Those beneficial owners should include their names and an image of their legal proxy in the email. Requests for registration must be received by Computershare no later than 5:00 p.m. Eastern Time, on April 30, 2021. Beneficial owners will then receive a confirmation of their registration, with a control number, by email from Computershare. At the time of the Annual Meeting, beneficial owners should go to http://www.meetingcenter.io/258120406 and enter their control number and the Annual Meeting password ES2021. If You Need Assistance Technical assistance for shareholders or their proxies will be available before or during the Annual Meeting by going to http://www.meetingcenter.io/258120406 and clicking on the “Attendance Instructions” box or clicking on the Help link once you have logged into the meeting center. Q: AS A PARTICIPANT IN THE EVERSOURCE 401(k) PLAN OR SAVINGS PLAN FOR EMPLOYEES OF AQUARION WATER COMPANY, HOW DO I VOTE MY SHARES HELD IN MY PLAN ACCOUNT? A: If you are a participant in the Eversource 401(k) Plan or the Savings Plan for Employees of Aquarion Water Company, you may vote the common shares held in your plan account by voting through the Internet or by telephone by following the instructions on the Notice of Internet Availability of Proxy Materials that you received in the mail. Internet voting and voting by telephone May 2, 2021. The Notice of Internet Availability of Proxy Materials also includes instructions for requesting printed proxy materials by mail. If you requested and received a paper proxy card, you may vote by mail by completing, signing and dating the proxy card and returning it in the pre-addressed, postage-prepaid envelope included with the proxy card. Whether you vote through the Internet, by telephone or by returning a proxy card in the mail, the plan trustee will vote the common shares held in your plan account in accordance with your instructions. If you do not provide the plan trustee with instructions by 11:59 p.m. Eastern Time on
76 2021 Proxy Statement Q: WHAT CONSTITUTES A QUORUM AND HOW ARE VOTES COUNTED? A: To conduct business at the Annual Meeting, a quorum consisting of a majority of all common shares issued and outstanding and entitled to vote must be present in person or represented by proxy. Representatives of Computershare Investor Services (Computershare), the Q: WHAT ARE BROKER NON-VOTES? A: Broker non-votes occur when brokers holding shares on behalf of beneficial owners do not receive voting instructions from the beneficial holders. If a broker does not have instructions and is barred by law or applicable rules from exercising its discretionary voting authority in the particular matter, then the shares will not be voted on the matter, resulting in a
2021 Proxy Statement 77 Q: WHO PAYS THE COST OF SOLICITING THE PROXIES REQUESTED? A: Eversource Energy will bear the cost of soliciting proxies on behalf of the Board of Trustees. In addition to the use of the mails, proxies may be solicited by telephone or electronic mail by officers or employees of Eversource Energy or its service company affiliate, Eversource Energy Service Company, who will not be specially compensated for such activities, and by employees of Computershare, our transfer agent and registrar. We have also retained D.F. King & Co., Inc., a professional proxy soliciting firm, to assist in the solicitation of proxies for a fee of $9,500, plus reimbursement of certain out-of-pocket expenses. We will request persons, firms and other companies holding common shares in their names or in the name of their nominees, which are beneficially owned by others as of March
![[MISSING IMAGE: tm212409d1-proxy_page14c.jpg]](https://capedge.com/proxy/DEF 14A/0001104659-21-042415/tm212409d1-proxy_page14c.jpg)
![[MISSING IMAGE: tm212409d1-proxy_page24c.jpg]](https://capedge.com/proxy/DEF 14A/0001104659-21-042415/tm212409d1-proxy_page24c.jpg)
| |||||||||||||||||||||||||||||||||||||||||||||||||||||||||||||||||||||||||||||||||||||||||||||||||||||||||||||||||||||||||||||||||||||||||||||||||||||||||||||||||||||||||||||||||||||||||||||||||||||||||||||||||||||||||||||||||||||||||||||||||||||||||||||||||||||||||||||||||||||||||||||||||||||||||||||||||||||||||||||||||||||||||||||||||||||||||||||||||||||||||||||||||||||||||||||||||||||||||||||||||||||||||||||||||||||||||||||||||||||||||||||||||||||||||||||||||||||||||||||||||||||||||||||||||||||||||||||||||||||||||||||||||||||||||||||||||||||||||||||||||||||||||||||||||||||||||||||||||||||||||||||||||||||||||||||||||||||||||||||||||||||||||||||||||||||||||||||||||||||||||||||||||||||||||||